Because the total population in 2050 is much larger than the Comparison of Population in the United States in 1950 and 2050 (in millions of persons) 1950 population, comparing percentages in each age group is clearer than comparing counts. Make a table of the Age Group 1950 2050 percentage of the total population in each age group for both Under 10 years | 29.3 56.2 1950 and 2050. 10 to 19 years 21.8 56.7 Only one age group in 1950 represents a larger percentage 20 to 29 years | 24.0 56.2 of the population than it does in 2050. For that age group, determine the difference of the percentages between 1950 30 to 39 years 22.8 55.9 40 to 49 years 19.3 52.8 and 2050. Report your answer to the tenth of a percent. 50 to 59 years 15.5 49.1 60 to 69 years 11.0 45.0 70 to 79 years 5.5 34.5 difference in percentages: % 80 to 89 years 1.6 23.7 90 to 99 years 0.1 8.1 100 years and 0.6 over
Because the total population in 2050 is much larger than the Comparison of Population in the United States in 1950 and 2050 (in millions of persons) 1950 population, comparing percentages in each age group is clearer than comparing counts. Make a table of the Age Group 1950 2050 percentage of the total population in each age group for both Under 10 years | 29.3 56.2 1950 and 2050. 10 to 19 years 21.8 56.7 Only one age group in 1950 represents a larger percentage 20 to 29 years | 24.0 56.2 of the population than it does in 2050. For that age group, determine the difference of the percentages between 1950 30 to 39 years 22.8 55.9 40 to 49 years 19.3 52.8 and 2050. Report your answer to the tenth of a percent. 50 to 59 years 15.5 49.1 60 to 69 years 11.0 45.0 70 to 79 years 5.5 34.5 difference in percentages: % 80 to 89 years 1.6 23.7 90 to 99 years 0.1 8.1 100 years and 0.6 over

Glencoe Algebra 1, Student Edition, 9780079039897, 0079039898, 2018
18th Edition
ISBN:9780079039897
Author:Carter
Publisher:Carter
Chapter10: Statistics
Section10.6: Summarizing Categorical Data
Problem 24PPS

Related questions
Question
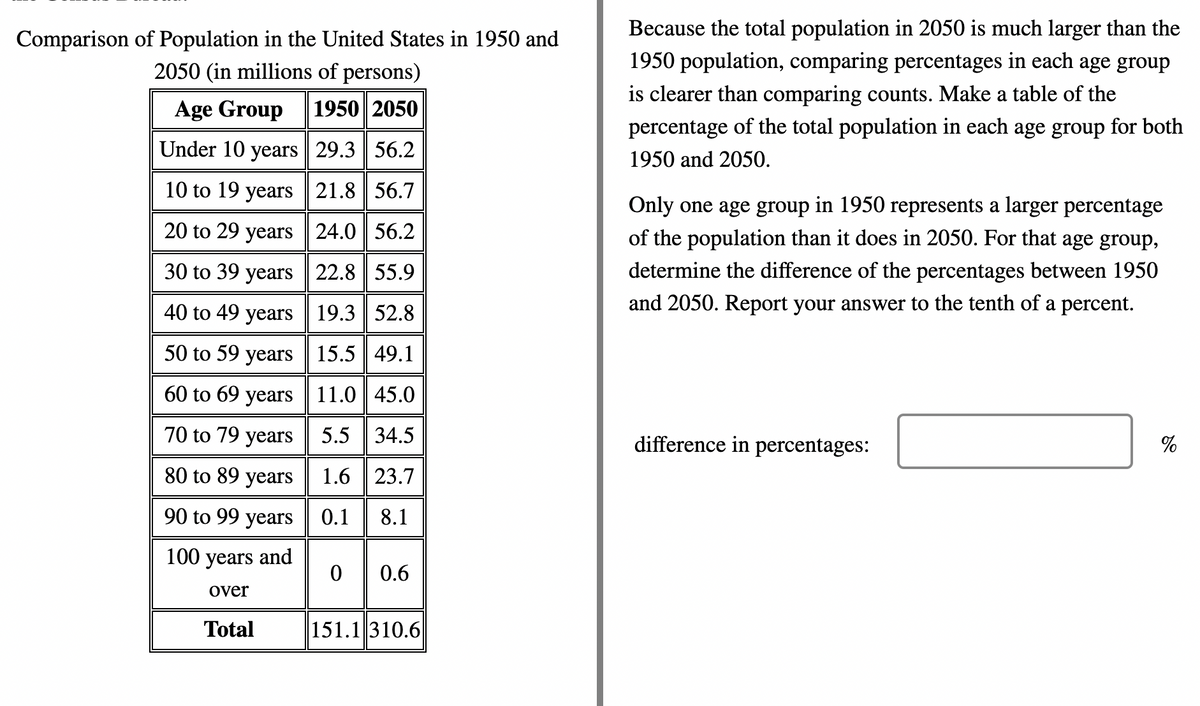
Transcribed Image Text:Because the total population in 2050 is much larger than the
Comparison of Population in the United States in 1950 and
2050 (in millions of persons)
1950 population, comparing percentages in each age group
is clearer than comparing counts. Make a table of the
Age Group
1950 2050
percentage of the total population in each age group for both
Under 10 years | 29.3 | 56.2
1950 and 2050.
10 to 19 years 21.8 || 56.7
Only one age group in 1950 represents a larger percentage
of the population than it does in 2050. For that age group,
20 to 29 years | 24.0 | 56.2
30 to 39 years | 22.8 | 55.9
determine the difference of the percentages between 1950
and 2050. Report your answer to the tenth of a percent.
40 to 49 years 19.3 52.8
50 to 59 years 15.5 || 49.1
60 to 69 years| 11.0 | 45.0
70 to 79 years
5.5 34.5
difference in percentages:
%
80 to 89 years
1.6 | 23.7
90 to 99 years
0.1
8.1
100 years and
0.6
over
Total
151.1 310.6
Expert Solution
Step 1
The solution is in the image uploaded below:

Trending now
This is a popular solution!

Step by step
Solved in 2 steps with 1 images

Recommended textbooks for you
Glencoe Algebra 1, Student Edition, 9780079039897…
Algebra
ISBN:
9780079039897
Author:
Carter
Publisher:
McGraw Hill

Algebra: Structure And Method, Book 1
Algebra
ISBN:
9780395977224
Author:
Richard G. Brown, Mary P. Dolciani, Robert H. Sorgenfrey, William L. Cole
Publisher:
McDougal Littell
Glencoe Algebra 1, Student Edition, 9780079039897…
Algebra
ISBN:
9780079039897
Author:
Carter
Publisher:
McGraw Hill
Algebra: Structure And Method, Book 1
Algebra
ISBN:
9780395977224
Author:
Richard G. Brown, Mary P. Dolciani, Robert H. Sorgenfrey, William L. Cole
Publisher:
McDougal Littell