Below are four bivariate data sets and their scatter plots. (Note that all of the scatter plots are display the same scale.) Each data set is made up of sample values drawn from a population. y u y 11 1.0 6.4 10- 114 10- 1.0 7.8 2.0 9.7 9- 9. 2.0 6.8 8+ 84 3.0 3.6 7+ 3.0 7.6 7+ X X X X 4.0 8.5 6- 4.0 6.0 6- 5. 5- 5.0 5.3 5.0 6.9 4- 4 6.0 2.1 3- 6.0 4.6 3- 2. 7.0 6.2 2- 7.0 4.7 1. 8.0 9.9 8.0 3.7 0 0 9.0 5.0 9.0 4.4 100 91 Figure 1 100/20 Figure 2 X X 11
Below are four bivariate data sets and their scatter plots. (Note that all of the scatter plots are display the same scale.) Each data set is made up of sample values drawn from a population. y u y 11 1.0 6.4 10- 114 10- 1.0 7.8 2.0 9.7 9- 9. 2.0 6.8 8+ 84 3.0 3.6 7+ 3.0 7.6 7+ X X X X 4.0 8.5 6- 4.0 6.0 6- 5. 5- 5.0 5.3 5.0 6.9 4- 4 6.0 2.1 3- 6.0 4.6 3- 2. 7.0 6.2 2- 7.0 4.7 1. 8.0 9.9 8.0 3.7 0 0 9.0 5.0 9.0 4.4 100 91 Figure 1 100/20 Figure 2 X X 11

Glencoe Algebra 1, Student Edition, 9780079039897, 0079039898, 2018
18th Edition
ISBN:9780079039897
Author:Carter
Publisher:Carter
Chapter10: Statistics
Section10.5: Comparing Sets Of Data
Problem 14PPS

Related questions
Question
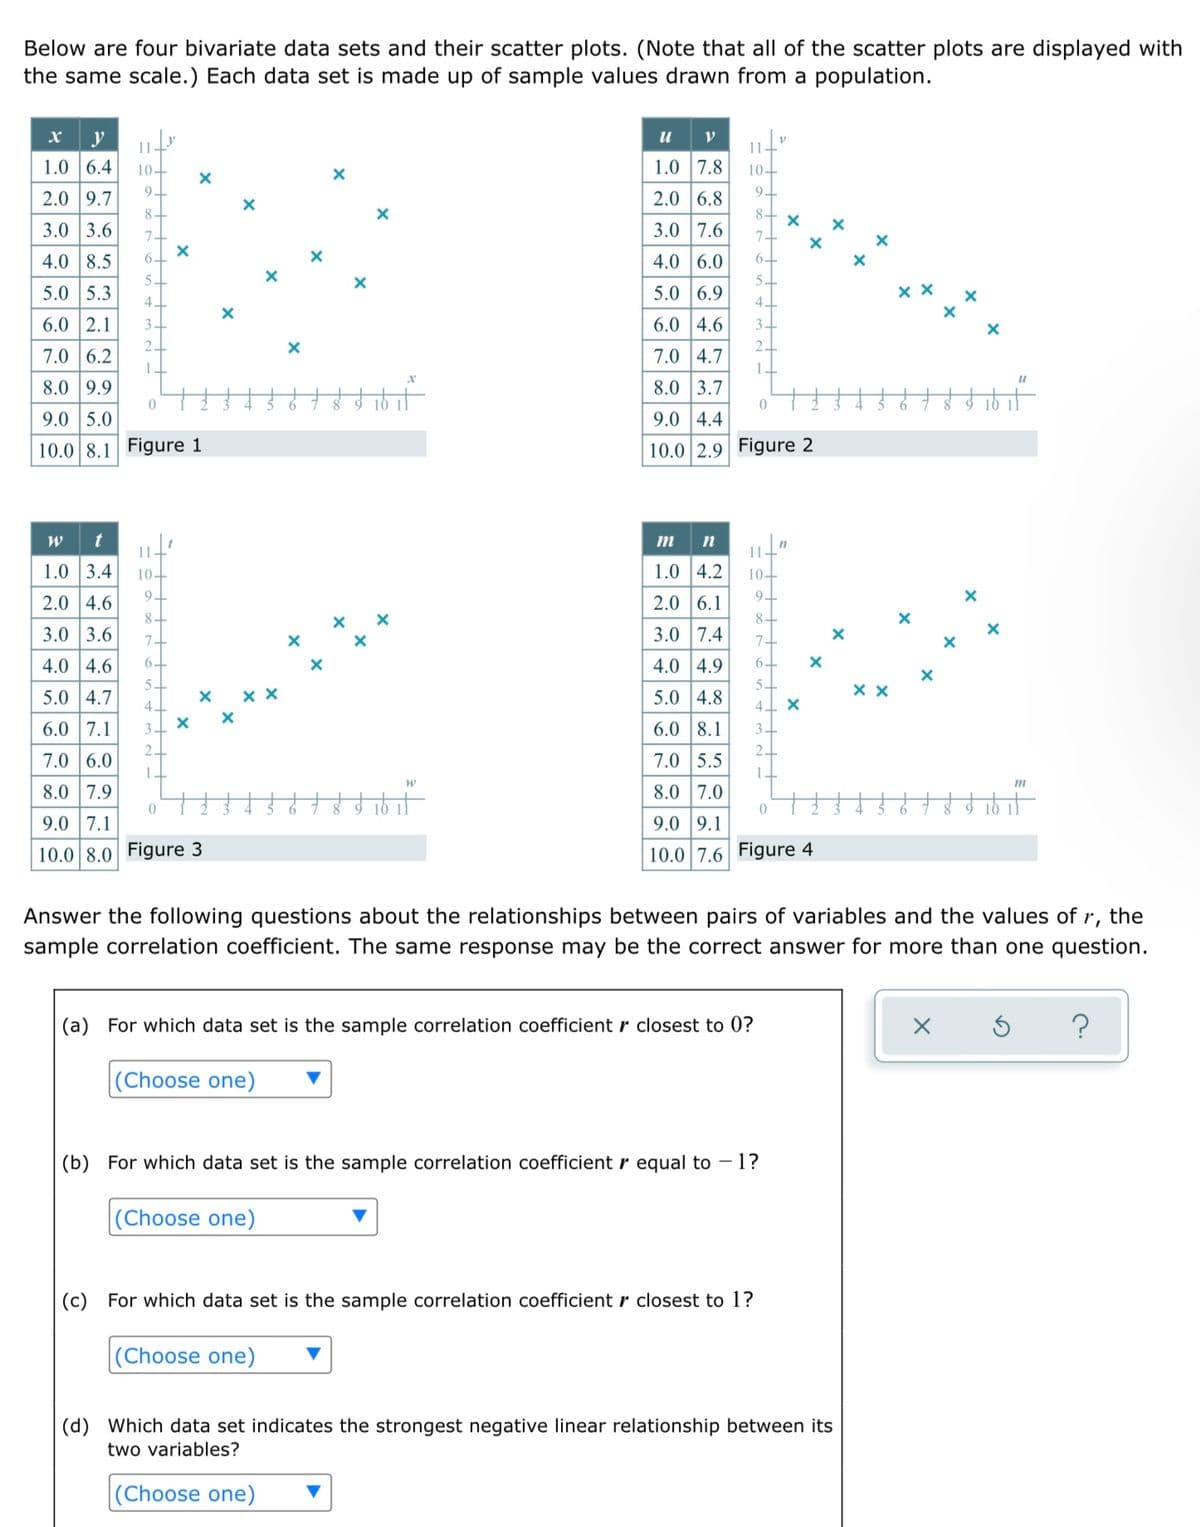
Transcribed Image Text:Below are four bivariate data sets and their scatter plots. (Note that all of the scatter plots are displayed with
the same scale.) Each data set is made up of sample values drawn from a population.
X y
1.0 6.4 10-
11-
10-
X
1.0 7.8
9
2.0 9.7
9
2.0
6.8
8+
8.
3.0 3.6
7.
3.0 7.6
7+
4.0 8.5 6-
4.0 6.0
6.
5.
5
5.0 5.3
5.0 6.9
x x
4.
4
6.0 2.1 3
6.0 4.6
3
2.
2
7.0 6.2
7.0 4.7
1.
1
8.0 9.9
8.0 3.7
0
0
9.0 5.0
9.0 4.4
10.0 8.1 Figure 1
10.0 2.9 Figure 2
W
t
mn
11-
11-
1.0 3.4
10-
1.0 4.2
10-
9+
2.0 4.6
9
2.0 6.1
8+
8.
3.0 3.6
7+
3.0 7.4
7
6+
4.0 4.6
6+
4.0 4.9
5.
5.0 4.7
5
4. X
5.0 4.8
4
6.0 7.1
3.
6.0 8.1
3.
2.
2
7.0 6.0
7.0 5.5
1.
1
8.0 7.9
m
8.0 7.0
0
16
0
9.0 7.1
9.0 9.1
10.0 8.0 Figure 3
10.0 7.6 Figure 4
Answer the following questions about the relationships between pairs of variables and the values of r, the
sample correlation coefficient. The same response may be the correct answer for more than one question.
(a) For which data set is the sample correlation coefficient r closest to 0?
X
?
(Choose one)
(b) For which data set is the sample correlation coefficient r equal to 1?
(Choose one)
(c) For which data set is the sample correlation coefficient r closest to 1?
(Choose one)
(d)
Which data set indicates the strongest negative linear relationship between its
two variables?
(Choose one)
X
X
X
6
X
X
ib it
W
X
Xxx
8
Expert Solution
This question has been solved!
Explore an expertly crafted, step-by-step solution for a thorough understanding of key concepts.

Step by step
Solved in 2 steps

Recommended textbooks for you
Glencoe Algebra 1, Student Edition, 9780079039897…
Algebra
ISBN:
9780079039897
Author:
Carter
Publisher:
McGraw Hill
Glencoe Algebra 1, Student Edition, 9780079039897…
Algebra
ISBN:
9780079039897
Author:
Carter
Publisher:
McGraw Hill