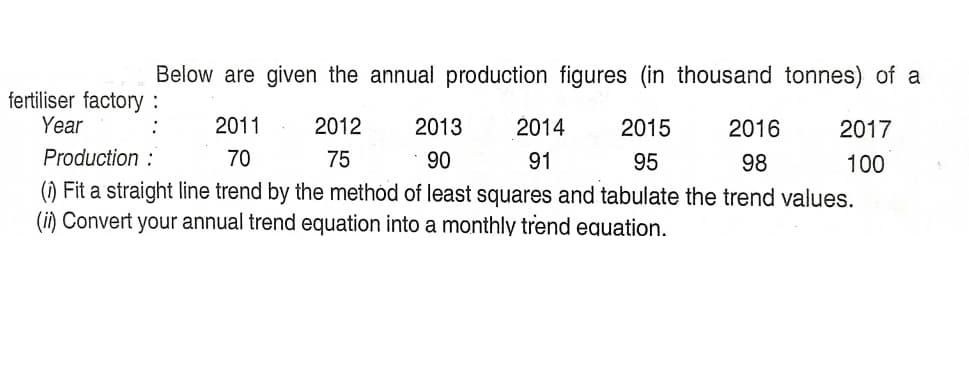
Below are given the annual production figures (in thousand tonnes) Fertiliser factory: Year 2011 2012 2013 2014 2015 2016 2017 Production : 70 75 90 91 95 98 100 (1) Fit a straight line trend by the method of least squares and tabulate the trend values. (i) Convert your annual trend equation into a monthly trend equation.


Q: 10. Let the discrete random variable X be the number of odd numbers that appear in 16 tosses of a fa...
A: Let X be the number of odd numbers that appear in 16 tosses of a fair die Probability that an odd n...
Q: A five letter code is to be made by choosing 5 letters from the first 7 letters of our alphabet (a, ...
A: Given : Total no. of letters = 7 This are : a , b , c , d , e , f , g A five letter code is made i....
Q: Complete solution with venn diagram please 300 students were sampled in the College of architechtur...
A:
Q: (Calculation of Percentile of Data Sample) Find π15% of the following observations {−1200, −980, −87...
A: Data given −1200, −980, −870, −525, −371, −108, 0, 15, 210, 453, 700, 1120 P15=?
Q: Critically/quantitatively evaluate the following statement (true, false or uncertain): • In a linear...
A: The likelihood of inconsistency parameter estimates due to endogenous regressors is a major difficul...
Q: lim + 2x – 15 Evaluate x → 3 x - 9 2. 2.
A:
Q: 5. A sample of n 36 from a population of u = 50 and o = 18 has a mean M = 47 the z-score for the sam...
A:
Q: How do you write a research questionnaire?
A: The objective is to write the steps in a research hypothesis.
Q: Suppose we have two groups of students, those who go for tutoring help and those who do not. The fol...
A:
Q: The following is a list of 14 measurements. - 13, -6, -45, 53, –3, 83, –23, 79, – 17, –96, – 18, 91,...
A: Given: A list of 14 measurements. -13,-6,-45,53,-3,83,-23,79,-17,-96,-18,91,53,-13
Q: To assess whether a data set fits a specific distribution, you can apply the ____________hypothesis ...
A: Solution-: We fill the following sentence with appropriate choices. To assess whether a data set fit...
Q: Individual Experience Experience of Others Combination 24.5 20.6 21.0 ...
A: For the given data Perform Anova one way test to test the claim that errors are equal.
Q: Complete parts a through e below. a. Find P (B1 N A). b. Find P (B2 A). c. Find P(A) using the resul...
A:
Q: Given X ~B(6, 0.29) find the probability: P(X_2)
A: Given X~Bin(n=6,p=0.29)
Q: Problem Solving: 5. The amount of X of beverage in a can labeled 12 ounces is normally distributed w...
A:
Q: what is the probability that the sample proportion will differ from the population proportion by les...
A: Goofy' fast food center wishes to estimate the proportion of people in its city that will purchase ...
Q: Kahuna's Credit Union conducted a survey as to how long customers claimed to wait in the checkout li...
A: x 0.5 1.75 2 2.25 2.25 2.5 2.75 3.25...
Q: r a standard normal distribution, find: P(-1.53 < z < 2.35)
A: For a standard normal distribution, find:P(-1.53 < z < 2.35)
Q: Mean of 100 observations is found to be 40. If at the time of computation two items are wrongly take...
A:
Q: With the help of the following data construct Fisher's Index Number : Wheat Rice Gram Year Quantity ...
A:
Q: Consider repeated rolling of a fair die, and assume that the different rolls are independent. For i ...
A: Given information: Rolling a fair die and different rolls are independent.
Q: he lengths of lumbar a machine cuts are normally distributed with a mean of 98 inches and a standard...
A: Given data,Mean μ=98sd σ=0.5
Q: 1.A factory has a machine that dispenses 80ml of fluid in a bottle. An employee believes the average...
A: Given Sample size, n=40Sample mean, x¯=78Sample sd, s=2.5CL=95%
Q: In a random sample of 8 people, the mean commute time to work was 34.5 minutes and the standard d...
A: Givensample size(n)=8Mean(x)=34.5for standard deviation(σ)=7.4 the 98% confidence interval is (26.7 ...
Q: Consider the following time series data. Month 1 2 3 4 Value 25 12 19 13 18 24 16 (a) Compute MSE us...
A: calculate the forecast error compute the mean squared error
Q: i) If you have twenty ones and fifteen zeroes how many ways can we arrange these digits such that no...
A: Disclaimer : Since you have asked multiple question, we will solve the first question for you. If yo...
Q: For two events A and B, P(A) = .4, P(B) = .2, P(A|B) = .6. a. Find P(AN B). b. Find P(B|A).
A: Given data,P(A)=0.4P(B)=0.2P(A|B)=0.6
Q: Compare a three-month moving average forecast with the exponential smoothing forecast for a = 0.3. C...
A: b) Three month moving average: 3-month moving average=sum of the 3 consequent values3 Percentag...
Q: A manufacturer of trucks wishes to test if the hoods being received from a supplier have an average ...
A:
Q: A person is to walk into a casino and play a certain game. The chance the person will win the game i...
A: Let X denote the no.of times gambler wins The given distribution table of X is, (a) The graph of pr...
Q: (i) Compute the KL-divergence of Normal RV with (mean) parameter µ1, µ2 under prob- ability measure ...
A: From the given information, There are two random variables with means μ1 and μ2, respectively. The v...
Q: A sample was taken by randomly selecting one student from the administration’s official list of stud...
A: Systematic sampling: When the population units occur in a sequence or pattern and a sample of size n...
Q: Suppose we want to do a poll to see what is the percentage, p of voters that will support president ...
A: a) Let us consider, p=0.5 Confidence level is 90%. From the standard normal table, the critical valu...
Q: 2. Information from the Department of Motor Vehicles indicates that the average age of licensed driv...
A:
Q: 8. A random sample of n = 36 scores is obtained from a population with a o = 12. If the sample mean ...
A:
Q: A researcher wanted to find out whether IQ is a function of family size. The speculation was that a...
A: Here researcher is doing an observational study in which he had categorical/grouping variable as fam...
Q: Complete solution to this please. thanks An experiment consists of asking 3 dishwashers at random i...
A: "Since you have posted a question with multiple subparts, we will solve first 3 sub-parts for you. T...
Q: For each probability expression, find the unknown z-value(s). Unless directed otherwise, use three d...
A: As per guideline expert have to answer first question three subparts only dear student please upload...
Q: A data set lists weights (Ib) of plastic discarded by households. The highest weight is 5.24 lb, the...
A:
Q: How many ways can 3 DVDs be selected for playing if they are to be chosen from 8 different DVDs? O...
A:
Q: A normal distribution has a mean of 132 with a standard deviation of 28. By the Empirical Rule appro...
A: Since you have asked multiple question, we will solve the first question for you. If you want any sp...
Q: You want to obtain a sample to estimate a population mean. Based on previous evidence, you believe t...
A: Given σ=79.8, level of significance=ɑ=0.05, Margin of error=moe=5 n=?
Q: 11. Consider the random variable X with probability density function fx (x) = a/a -1<r < 1, where a ...
A:
Q: A car lot wants to predict the # of car accessories they need to sell monthly based on the number of...
A: The coefficient of determination is 0.6364.
Q: Questions: (b) What percentage of employees make less than $10,000 per month? (c) Write a sent...
A: Questions: (b) What percentage of employees make less than $10,000 per month?(c) Write a sentence ...
Q: A positive value of the correlation coefficient "r" means_________ Group of answer choices that whe...
A: The value ρ = 0, confirms the lack of linear association between two variables. In this case, all th...
Q: 7. A fair die is rolled three times. Find the probability that one or more fours appear given that t...
A: Given: A die is rolled thrice.
Q: d. 71% of all cars travel at least how fast on the freeway? mph.
A:
Q: In a large section of statistics class for the final exam are normally distributed, with a mean of 7...
A: Given: μ=72σ=9x~N(72,92)
Q: In the country of United States of Heightlandia, the height measurements of ten-year-old children ar...
A:

Step by step
Solved in 3 steps with 3 images

- Olympic Pole Vault The graph in Figure 7 indicates that in recent years the winning Olympic men’s pole vault height has fallen below the value predicted by the regression line in Example 2. This might have occurred because when the pole vault was a new event there was much room for improvement in vaulters’ performances, whereas now even the best training can produce only incremental advances. Let’s see whether concentrating on more recent results gives a better predictor of future records. (a) Use the data in Table 2 (page 176) to complete the table of winning pole vault heights shown in the margin. (Note that we are using x=0 to correspond to the year 1972, where this restricted data set begins.) (b) Find the regression line for the data in part ‚(a). (c) Plot the data and the regression line on the same axes. Does the regression line seem to provide a good model for the data? (d) What does the regression line predict as the winning pole vault height for the 2012 Olympics? Compare this predicted value to the actual 2012 winning height of 5.97 m, as described on page 177. Has this new regression line provided a better prediction than the line in Example 2?Based on previous statistics, the dean of a business school forecasts total student attendance for this year's summer session classes: Year Enrollment Four years ago 2000 Three years ago 2200 Two years ago 2800 Last year 3000 What is the annual rate of change (slope) of the least squares trend line for these data?Q3 The following data relates to the gross value of output of a factory over the last few years:Year 2014 2015 2016 2017 2018 2019 2020Production(in ‘000 tons)60 72.5 85.6 106.8 125.5 145.4 156.2Fit a straight-line trend using the method of least squares. Calculate the parabolic trend equation to predict the average annual output. Predict the trend values using each of the model and comment on its suitability
- Compute the forecasted values for Yt for July and August in 2020 by using the modelsstated in (c) and (d)The table given below indicates Small Holding Ltd.’s quarterly profits in 2019 and 2020.Time Period Profit (Thousands Of Rands)2019 Q1 2502019 Q2 2102019 Q3 1652019 Q4 1952020 Q1 2652020 Q2 2182020 Q3 1782020 Q4 204Q.6.3.1 Determine the trend regression function for this data set. In order to obtain full marks for this question, you must complete the relevanttable (template provided below) and then apply the appropriate timeseries formulae in the formulae sheet.Q.6.3.2 Given that the typical seasonal index for Q3 is 87.3, use this informationand the trend regression function obtained in Q.6.3.1 to determine theseasonally adjusted trend estimate for profits in Q3 of 2022.The table given below indicates New Holding Ltd.’s quarterly profits in 2019 and 2020.Time Period Profit (Thousands Of Rands)2019 Q1 2502019 Q2 2102019 Q3 1652019 Q4 1952020 Q1 2652020 Q2 2182020 Q3 1782020 Q4 204 Determine the trend regression function for this data set. Given that the typical seasonal index for Q3 is 87.3, use this informationand the trend regression function obtained to determine theseasonally adjusted trend estimate for profits in Q3 of 2022.
- Use a smoothing constant ALPHA = 0.8 and calculate the forecasted value and smoothing valueThe table given below indicates Small Holding Ltd.’s quarterly profits in 2019 and2020.Time Period Profit (Thousands Of Rands)2019 Q12019 Q22019 Q32019 Q42020 Q12020 Q22020 Q32020 Q4250210165195265218178204Q.6.3.1 Determine the trend regression function for this data set. In order toobtain full marks for this question, you must complete the relevanttable (template provided below) and then apply the appropriate timeseries formulae in the formulae sheet.The following time series shows the sales of supermarket chain over the last six months. Month Sales ($ 000) August 2021 250 Sep 2021 280 Oct 2021 295 Nov 2021 320 Dec 2021 380 Jan 2022 360 Develop a linear trend equation that can be used to forecast sales in Feb 2022. Forecast the sales in Feb 2021 using a three-period weighted moving average designed with the following weights: Nov 2021 weight 0.6, Dec 2021 weight 0.3 and Jan 2022 weight 0.1. Which method (A or B) is the best? Explain why.
- The following data resulted from a study commissioned by a large management consulting company to investigate the relationship between amount of job experience (months) for a junior consultant and the likelihood of the consultant being able to perform a certain complex task. (image w/ success and failure) Interpret the accompanying MINITAB logistic regression output, and sketch a graph of the estimated probability of task performance as a function of experience. (2nd image)hudson Marine has been an authorized dealer for c&d marine radios for the past sevenyears. the following table reports the number of radios sold each year.Year 1 2 3 4 5 6 7Number Sold 35 50 75 90 105 110 130a. construct a time series plot. does a linear trend appear to be present?b. Using Minitab or excel, develop a linear trend equation for this time series.c. Use the linear trend equation developed in part (b) to develop a forecast for annualsales in year 8.The sales records of a major auto manufacturer over the past years from 2005 to 2019 are shown below. Number of Cars Sold Year (In thousands of Units) 2005 195 2006 200 2007 250 2008 270 2009 320 2010 380 2011 440 2012 460 2013 500 2014 500 2015 550 2016 570 2017 600 2018 650 2019 700 Develop moving average with k=4 and compute its MSE Develop exponential model with α = 0.4 and compute its MSE Develop a linear trend model and compute its MSE Based on the MSE computed fore ach model , which model fits well to the data Based on the answer of question (4) forecast the number of cars sold for year 2020.

