Below are the life history characteristics for three species of ocean dwelling organisms. Match which species should have which type of survivorship curve. Life History Characteristics Species # of offspring investment per offspring A intermediate moderate few high C many low
Below are the life history characteristics for three species of ocean dwelling organisms. Match which species should have which type of survivorship curve. Life History Characteristics Species # of offspring investment per offspring A intermediate moderate few high C many low

Concepts of Biology
1st Edition
ISBN:9781938168116
Author:Samantha Fowler, Rebecca Roush, James Wise
Publisher:Samantha Fowler, Rebecca Roush, James Wise
Chapter19: Population And Community Ecology
Section: Chapter Questions
Problem 5RQ: Which of the following is best at showing the life expectancy of an individual within a population?...

Related questions

Question
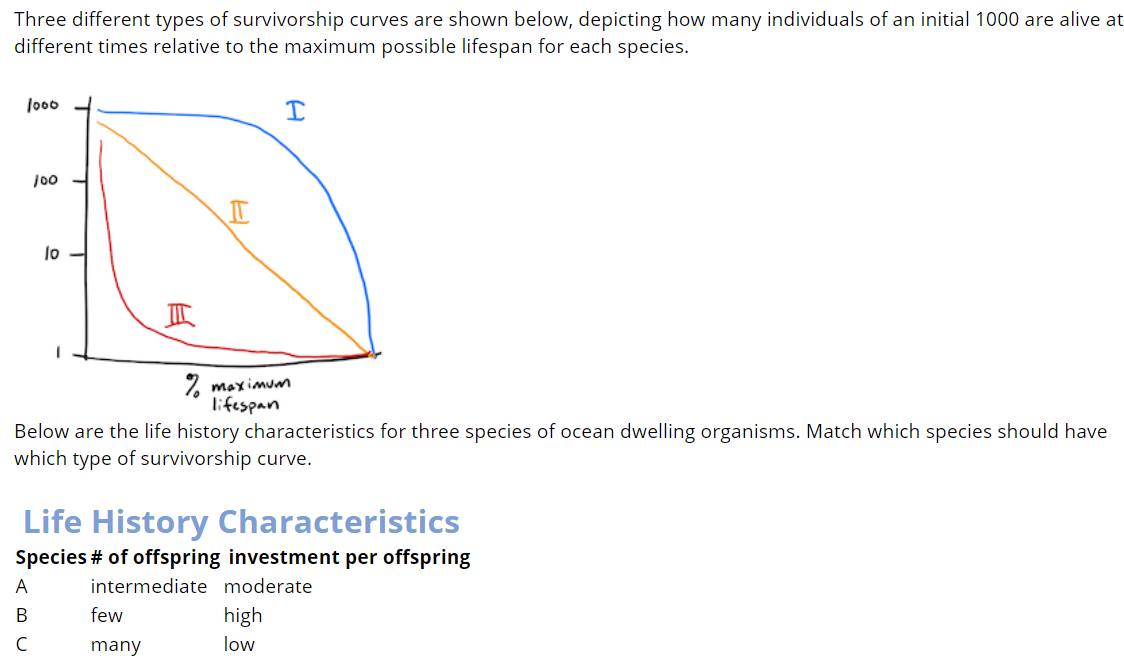
Transcribed Image Text:Three different types of survivorship curves are shown below, depicting how many individuals of an initial 1000 are alive at
different times relative to the maximum possible lifespan for each species.
lo00
I
100
2 maximun
lifespan
Below are the life history characteristics for three species of ocean dwelling organisms. Match which species should have
which type of survivorship curve.
Life History Characteristics
Species # of offspring investment per offspring
A
intermediate moderate
few
high
many
low
Expert Solution
This question has been solved!
Explore an expertly crafted, step-by-step solution for a thorough understanding of key concepts.

This is a popular solution!

Trending now
This is a popular solution!

Step by step
Solved in 2 steps

Knowledge Booster


Learn more about
Need a deep-dive on the concept behind this application? Look no further. Learn more about this topic, biology and related others by exploring similar questions and additional content below.Recommended textbooks for you
Concepts of Biology
Biology
ISBN:
9781938168116
Author:
Samantha Fowler, Rebecca Roush, James Wise
Publisher:
OpenStax College
Concepts of Biology
Biology
ISBN:
9781938168116
Author:
Samantha Fowler, Rebecca Roush, James Wise
Publisher:
OpenStax College