For the unicorn shrimp population shown in the cohort life table below, what type of survivorship curve best describes this population? A. Type I B. Type II C. Type III D. Geometric E. Logistic
For the unicorn shrimp population shown in the cohort life table below, what type of survivorship curve best describes this population? A. Type I B. Type II C. Type III D. Geometric E. Logistic

Chapter18: Food Safety
Section: Chapter Questions
Problem B2CR

Related questions

Question
For the unicorn shrimp population shown in the cohort life table below, what type of survivorship curve best describes this population?
| A. |
Type I |
|
| B. |
Type II |
|
| C. |
Type III |
|
| D. |
Geometric |
|
| E. |
Logistic |
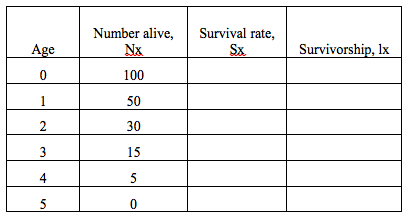
Transcribed Image Text:Number alive,
Nx
Survival rate,
Sx
Survivorship, Ix
Age
100
1
50
2
30
15
4
5
5
3.
Expert Solution
Step 1
A graph displaying the relationship between the number of surviving organisms (Y-axis) and the age of the organism (X-axis) is termed as ‘survivorship curve’.
Survivorship curves are usually made considering the individuals belonging to the same species.

Trending now
This is a popular solution!

Step by step
Solved in 2 steps

Knowledge Booster


Learn more about
Need a deep-dive on the concept behind this application? Look no further. Learn more about this topic, biology and related others by exploring similar questions and additional content below.Recommended textbooks for you
Health Safety And Nutrition F/Young Child
Health & Nutrition
ISBN:
9781305144767
Author:
MAROTZ
Publisher:
Cengage
Health Safety And Nutrition F/Young Child
Health & Nutrition
ISBN:
9781305144767
Author:
MAROTZ
Publisher:
Cengage