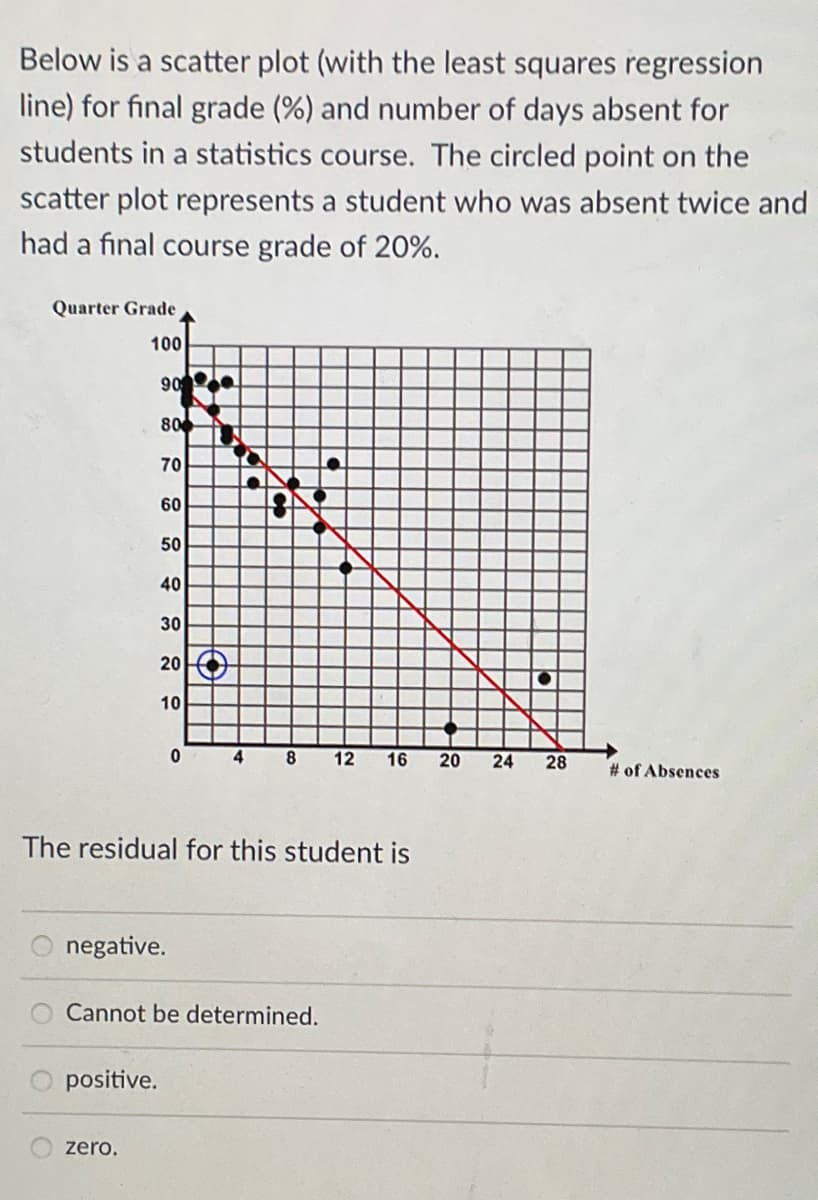
Below is a scatter plot (with the least squares regression line) for final grade (%) and number of days absent for students in a statistics course. The circled point on the scatter plot represents a student who was absent twice and had a final course grade of 20%. Quarter Grade 100 90 80 70 60 50 40 30 20 10 0 4 8 12 16 20 24 28 # of Absences
Below is a scatter plot (with the least squares regression line) for final grade (%) and number of days absent for students in a statistics course. The circled point on the scatter plot represents a student who was absent twice and had a final course grade of 20%. Quarter Grade 100 90 80 70 60 50 40 30 20 10 0 4 8 12 16 20 24 28 # of Absences

Linear Algebra: A Modern Introduction
4th Edition
ISBN:9781285463247
Author:David Poole
Publisher:David Poole
Chapter7: Distance And Approximation
Section7.3: Least Squares Approximation
Problem 31EQ

Related questions
Question
Answer very quickly please
Transcribed Image Text:Below is a scatter plot (with the least squares regression
line) for final grade (%) and number of days absent for
students in a statistics course. The circled point on the
scatter plot represents a student who was absent twice and
had a final course grade of 20%.
Quarter Grade
100
90
800
positive.
70
zero.
60
50
40
30
20
10
negative.
0
4
The residual for this student is
8
Cannot be determined.
12 16 20
24
28
# of Absences
Expert Solution
This question has been solved!
Explore an expertly crafted, step-by-step solution for a thorough understanding of key concepts.

Step by step
Solved in 2 steps

Recommended textbooks for you
Linear Algebra: A Modern Introduction
Algebra
ISBN:
9781285463247
Author:
David Poole
Publisher:
Cengage Learning

Glencoe Algebra 1, Student Edition, 9780079039897…
Algebra
ISBN:
9780079039897
Author:
Carter
Publisher:
McGraw Hill

College Algebra
Algebra
ISBN:
9781305115545
Author:
James Stewart, Lothar Redlin, Saleem Watson
Publisher:
Cengage Learning
Linear Algebra: A Modern Introduction
Algebra
ISBN:
9781285463247
Author:
David Poole
Publisher:
Cengage Learning
Glencoe Algebra 1, Student Edition, 9780079039897…
Algebra
ISBN:
9780079039897
Author:
Carter
Publisher:
McGraw Hill
College Algebra
Algebra
ISBN:
9781305115545
Author:
James Stewart, Lothar Redlin, Saleem Watson
Publisher:
Cengage Learning