Below is selected information from Marker's 2012 financial statements: Cash and short-term investments Accounts Receivable (net) Inventories Prepaid Expenses and other current assets Total Current Assets Plant, Property and Equipment, net Intangible Assets Total Assets As of Dec. 31, 2012 Dec. 31, 2011 $ 978,245 125,850 $ 745,800 135,400 195,650 175,840 45,300 30,860 $1,345,045 $1,087,900 1,478,320 125,600 $2,948,965 1,358,700 120,400 $2,567,000 Short-term borrowings Current portion of long-term debt Accounts payable $ 25,190 45,000 $ 38,108 40,000 325,900 Accrued liabilities Income taxes payable Total Current Liabilities Long-term Debt Total Liabilities 285,400 916,722 705,891 125,400 115,600 $1,397,712 $1,225,499 470,000 430,000 $1,867,712 $1,655,499 $1,081,253 $2,948,965 $ 911,501 $2,567,000 Shareholders' Equity Total Liabilities and Shareholders' Equity Selected Income Statement Data - for the year ending December 31, 2012: Net Sales Cost of Goods Sold $3,810,645 (2,310,210) Operating Income Net Income $ 1,500,435 $ 324,850 Selected Statement of Cash Flow Data - for the year ending December 31, 2012: Cash Flows from Operations Interest Expense $584,750 42,400 114,200 Income Tax Expense 21. Calculate Marker's 2012 Interest Coverage ratio: 22. Calculate Marker's 2012 Long-term Debt to Shareholders' Equity ratio is: 23. Calculate Mark's current ratio 24. Calculate Marker's accounts receivable turnover ratio:rect method, an increase in Inverto 25. Calculate Marker's quick ratio:vities section
Below is selected information from Marker's 2012 financial statements: Cash and short-term investments Accounts Receivable (net) Inventories Prepaid Expenses and other current assets Total Current Assets Plant, Property and Equipment, net Intangible Assets Total Assets As of Dec. 31, 2012 Dec. 31, 2011 $ 978,245 125,850 $ 745,800 135,400 195,650 175,840 45,300 30,860 $1,345,045 $1,087,900 1,478,320 125,600 $2,948,965 1,358,700 120,400 $2,567,000 Short-term borrowings Current portion of long-term debt Accounts payable $ 25,190 45,000 $ 38,108 40,000 325,900 Accrued liabilities Income taxes payable Total Current Liabilities Long-term Debt Total Liabilities 285,400 916,722 705,891 125,400 115,600 $1,397,712 $1,225,499 470,000 430,000 $1,867,712 $1,655,499 $1,081,253 $2,948,965 $ 911,501 $2,567,000 Shareholders' Equity Total Liabilities and Shareholders' Equity Selected Income Statement Data - for the year ending December 31, 2012: Net Sales Cost of Goods Sold $3,810,645 (2,310,210) Operating Income Net Income $ 1,500,435 $ 324,850 Selected Statement of Cash Flow Data - for the year ending December 31, 2012: Cash Flows from Operations Interest Expense $584,750 42,400 114,200 Income Tax Expense 21. Calculate Marker's 2012 Interest Coverage ratio: 22. Calculate Marker's 2012 Long-term Debt to Shareholders' Equity ratio is: 23. Calculate Mark's current ratio 24. Calculate Marker's accounts receivable turnover ratio:rect method, an increase in Inverto 25. Calculate Marker's quick ratio:vities section

Chapter16: Statement Of Cash Flows
Section: Chapter Questions
Problem 10PB: Use the following excerpts from Mountain Companys financial information to prepare a statement of...

Related questions
Question
23 and 24 please
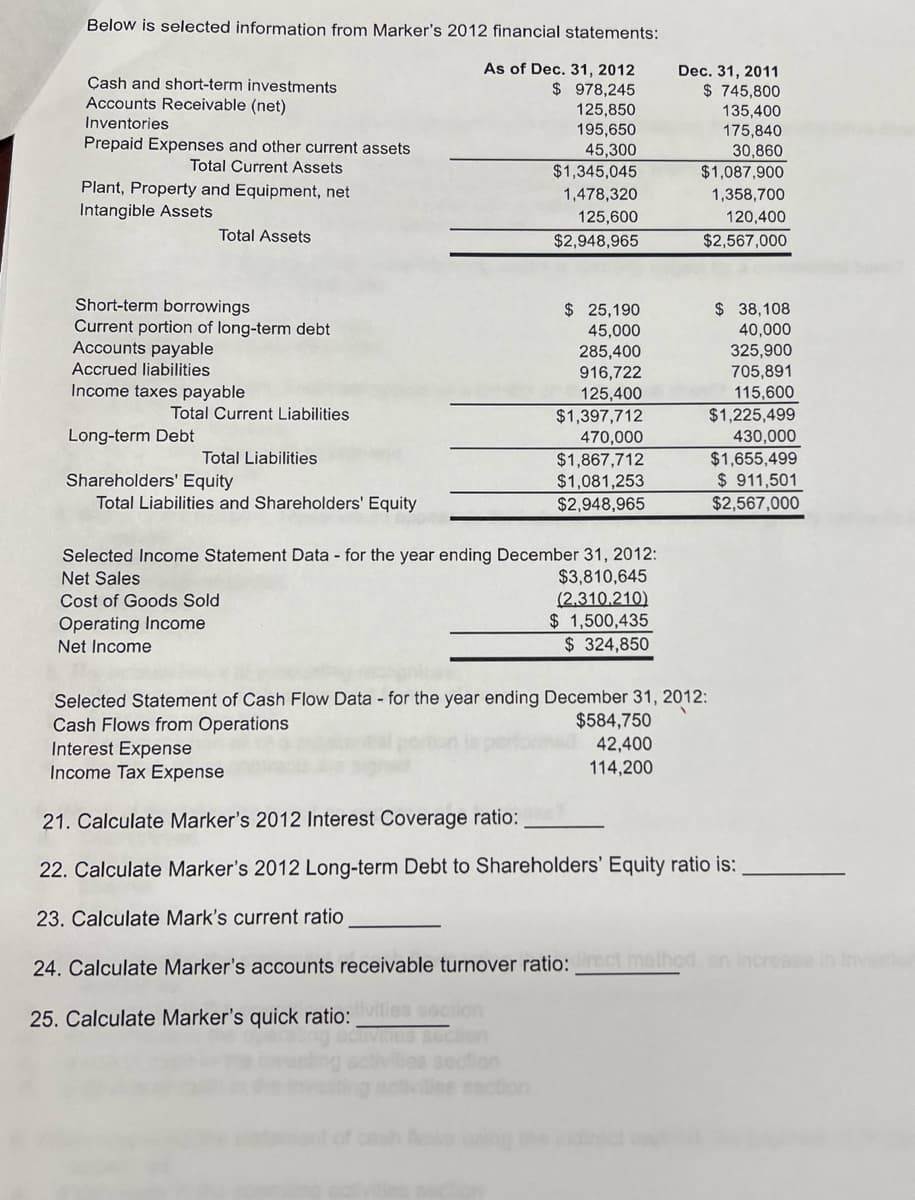
Transcribed Image Text:Below is selected information from Marker's 2012 financial statements:
Cash and short-term investments
Accounts Receivable (net)
Inventories
Prepaid Expenses and other current assets
Total Current Assets
Plant, Property and Equipment, net
Intangible Assets
Total Assets
As of Dec. 31, 2012
Dec. 31, 2011
$ 978,245
125,850
$ 745,800
135,400
195,650
175,840
45,300
30,860
$1,345,045
$1,087,900
1,478,320
125,600
$2,948,965
1,358,700
120,400
$2,567,000
Short-term borrowings
Current portion of long-term debt
Accounts payable
$ 25,190
45,000
$ 38,108
40,000
325,900
Accrued liabilities
Income taxes payable
Total Current Liabilities
Long-term Debt
Total Liabilities
285,400
916,722
705,891
125,400
115,600
$1,397,712
$1,225,499
470,000
430,000
$1,867,712
$1,655,499
$1,081,253
$2,948,965
$ 911,501
$2,567,000
Shareholders' Equity
Total Liabilities and Shareholders' Equity
Selected Income Statement Data - for the year ending December 31, 2012:
Net Sales
Cost of Goods Sold
$3,810,645
(2,310,210)
Operating Income
Net Income
$ 1,500,435
$ 324,850
Selected Statement of Cash Flow Data - for the year ending December 31, 2012:
Cash Flows from Operations
Interest Expense
$584,750
42,400
114,200
Income Tax Expense
21. Calculate Marker's 2012 Interest Coverage ratio:
22. Calculate Marker's 2012 Long-term Debt to Shareholders' Equity ratio is:
23. Calculate Mark's current ratio
24. Calculate Marker's accounts receivable turnover ratio:rect method, an increase in Inverto
25. Calculate Marker's quick ratio:vities section
Expert Solution
This question has been solved!
Explore an expertly crafted, step-by-step solution for a thorough understanding of key concepts.

Step by step
Solved in 2 steps

Recommended textbooks for you
Principles of Accounting Volume 1
Accounting
ISBN:
9781947172685
Author:
OpenStax
Publisher:
OpenStax College
Principles of Accounting Volume 1
Accounting
ISBN:
9781947172685
Author:
OpenStax
Publisher:
OpenStax College