Below, we have the particle size distributions for two sils A and B. Classify the soils according to the USDA textural classification system. Soil Particle-Size Distribution (%) B. Gravel 18 Sand 15 33 Silt 30 30 Clay 55 19
Below, we have the particle size distributions for two sils A and B. Classify the soils according to the USDA textural classification system. Soil Particle-Size Distribution (%) B. Gravel 18 Sand 15 33 Silt 30 30 Clay 55 19

Fundamentals of Geotechnical Engineering (MindTap Course List)
5th Edition
ISBN:9781305635180
Author:Braja M. Das, Nagaratnam Sivakugan
Publisher:Braja M. Das, Nagaratnam Sivakugan
Chapter4: Soil Classification
Section: Chapter Questions
Problem 4.7CTP: For the soils that are classified by the following AASHTO symbols, what would be the most likely...

Related questions
Question
Geology for Engineers
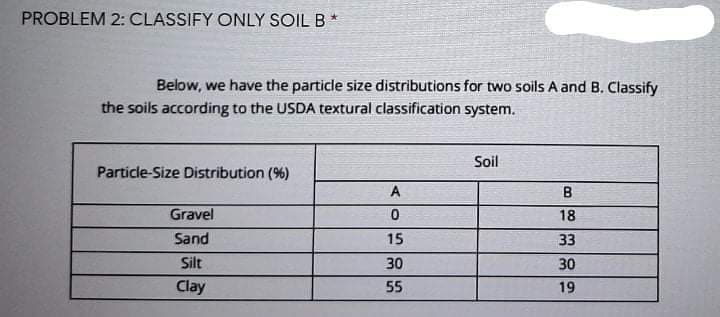
Transcribed Image Text:PROBLEM 2: CLASSIFY ONLY SOIL B *
Below, we have the particle size distributions for two soils A and B. Classify
the soils according to the USDA textural classification system.
Soil
Particle-Size Distribution (%)
A
B
Gravel
18
Sand
15
33
Silt
30
30
Clay
55
19
Expert Solution
This question has been solved!
Explore an expertly crafted, step-by-step solution for a thorough understanding of key concepts.

Step by step
Solved in 3 steps with 2 images

Knowledge Booster


Learn more about
Need a deep-dive on the concept behind this application? Look no further. Learn more about this topic, civil-engineering and related others by exploring similar questions and additional content below.Recommended textbooks for you
Fundamentals of Geotechnical Engineering (MindTap…
Civil Engineering
ISBN:
9781305635180
Author:
Braja M. Das, Nagaratnam Sivakugan
Publisher:
Cengage Learning
Fundamentals of Geotechnical Engineering (MindTap…
Civil Engineering
ISBN:
9781305635180
Author:
Braja M. Das, Nagaratnam Sivakugan
Publisher:
Cengage Learning