BHdeted a study 18 explore sales strategies, pročesses, änd support systems within businesses. Organizations were categorized by sales performance level (top performers vs. middle performers vs. bottom ales orga ormers) and extent to which the organization invests in customer satisfaction. Results were organized into the accompanying contingency table. At the 0.01 level of significance, is there evidence of a significant relationship tween sales performance level and level of investment in customer satisfaction? Click the icon to view the contingency table. Sales performance and level of investment at are the null and alternative hypotheses to test? SALES PERFORMANCE LEVEL D No relationship exists between sales performance level and level of investment. LEVEL OF INVESTMENT Top Middle Annually Every 2 to 4 years Bottom Total A relationship exists between sales performance level and level of investment. 55 305 50 410 43 244 18 305 culate the test statistic. Never 12 163 33 208 Total 110 712 101 923 AT und to two decimal places as needed.) p-value for XSTAT is. Print Done und to three decimal places as needed.) e the conclusion. e the p-value is than the level of significance, V the null hypothesis and conclude that there is V significant relationship.
BHdeted a study 18 explore sales strategies, pročesses, änd support systems within businesses. Organizations were categorized by sales performance level (top performers vs. middle performers vs. bottom ales orga ormers) and extent to which the organization invests in customer satisfaction. Results were organized into the accompanying contingency table. At the 0.01 level of significance, is there evidence of a significant relationship tween sales performance level and level of investment in customer satisfaction? Click the icon to view the contingency table. Sales performance and level of investment at are the null and alternative hypotheses to test? SALES PERFORMANCE LEVEL D No relationship exists between sales performance level and level of investment. LEVEL OF INVESTMENT Top Middle Annually Every 2 to 4 years Bottom Total A relationship exists between sales performance level and level of investment. 55 305 50 410 43 244 18 305 culate the test statistic. Never 12 163 33 208 Total 110 712 101 923 AT und to two decimal places as needed.) p-value for XSTAT is. Print Done und to three decimal places as needed.) e the conclusion. e the p-value is than the level of significance, V the null hypothesis and conclude that there is V significant relationship.

Glencoe Algebra 1, Student Edition, 9780079039897, 0079039898, 2018
18th Edition
ISBN:9780079039897
Author:Carter
Publisher:Carter
Chapter10: Statistics
Section10.6: Summarizing Categorical Data
Problem 27PPS

Related questions
Question
Need help answering this question please help
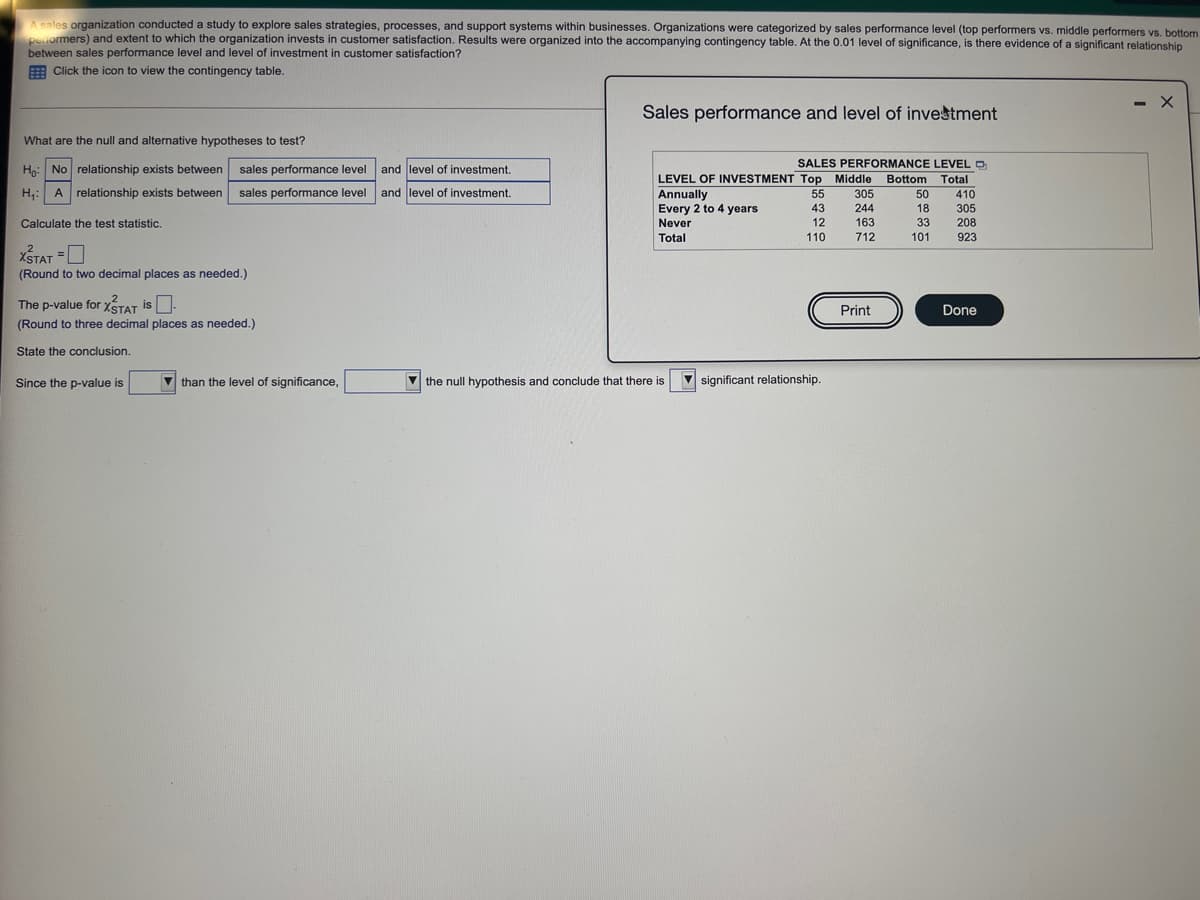
Transcribed Image Text:A sales organization conducted a study to explore sales strategies, processes, and support systems within businesses. Organizations were categorized by sales performance level (top performers vs. middle performers vs. bottom
peiormers) and extent to which the organization invests in customer satisfaction. Results were organized into the accompanying contingency table. At the 0.01 level of significance, is there evidence of a significant relationship
between sales performance level and level of investment in customer satisfaction?
E Click the icon to view the contingency table.
- X
Sales performance and level of investment
What are the null and altermative hypotheses to test?
SALES PERFORMANCE LEVEL O
Ho: No relationship exists between
sales performance level
and level of investment.
LEVEL OF INVESTMENT Top Middle
Annually
Every 2 to 4 years
Never
Bottom
Total
H,: A relationship exists between
sales performance level
and level of investment.
55
305
50
410
43
244
18
305
Calculate the test statistic.
12
163
33
208
Total
110
712
101
923
XSTAT =
(Round to two decimal places as needed.)
The p-value for xTAT is .
Print
Done
(Round to three decimal places as needed.)
State the conclusion.
Since the p-value is
than the level of significance,
V the null hypothesis and conclude that there is
V significant relationship.
Expert Solution
This question has been solved!
Explore an expertly crafted, step-by-step solution for a thorough understanding of key concepts.

This is a popular solution!

Trending now
This is a popular solution!

Step by step
Solved in 3 steps with 3 images

Recommended textbooks for you
Glencoe Algebra 1, Student Edition, 9780079039897…
Algebra
ISBN:
9780079039897
Author:
Carter
Publisher:
McGraw Hill

Big Ideas Math A Bridge To Success Algebra 1: Stu…
Algebra
ISBN:
9781680331141
Author:
HOUGHTON MIFFLIN HARCOURT
Publisher:
Houghton Mifflin Harcourt
Glencoe Algebra 1, Student Edition, 9780079039897…
Algebra
ISBN:
9780079039897
Author:
Carter
Publisher:
McGraw Hill
Big Ideas Math A Bridge To Success Algebra 1: Stu…
Algebra
ISBN:
9781680331141
Author:
HOUGHTON MIFFLIN HARCOURT
Publisher:
Houghton Mifflin Harcourt