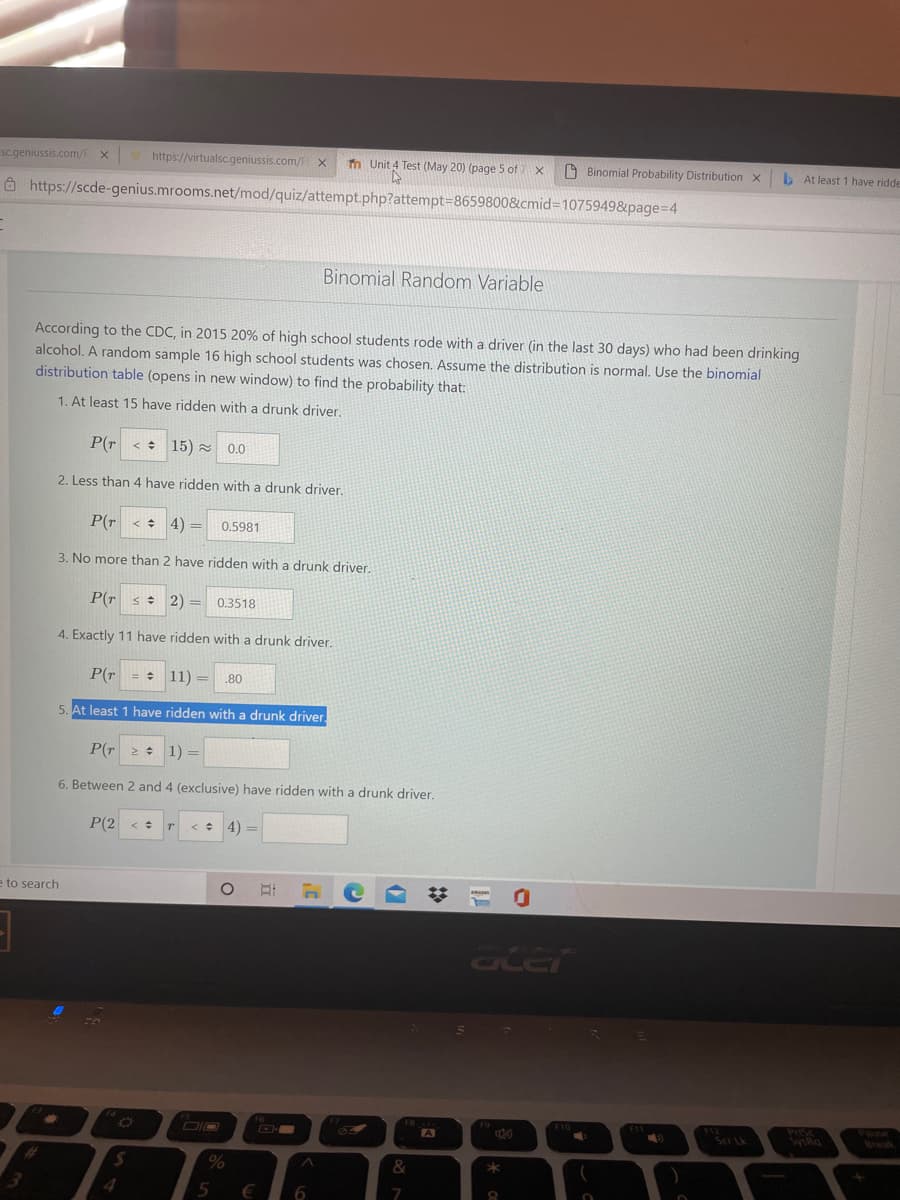
Binomial Random Variable According to the CDC, in 2015 20% of high school students rode with a driver (in the last 30 days) who had been drinking alcohol. A random sample 16 high school students was chosen. Assume the distribution is normal. Use the binomial distribution table (opens in new window) to find the probability that: 1. At least 15 have ridden with a drunk driver. P(r < 15) = 0.0 2. Less than 4 have ridden with a drunk driver. P(r くき 4)


Continuous Probability Distributions
Probability distributions are of two types, which are continuous probability distributions and discrete probability distributions. A continuous probability distribution contains an infinite number of values. For example, if time is infinite: you could count from 0 to a trillion seconds, billion seconds, so on indefinitely. A discrete probability distribution consists of only a countable set of possible values.
Normal Distribution
Suppose we had to design a bathroom weighing scale, how would we decide what should be the range of the weighing machine? Would we take the highest recorded human weight in history and use that as the upper limit for our weighing scale? This may not be a great idea as the sensitivity of the scale would get reduced if the range is too large. At the same time, if we keep the upper limit too low, it may not be usable for a large percentage of the population!


Trending now
This is a popular solution!

Step by step
Solved in 2 steps with 1 images


