Blue Brown Green Orange Red Yellow Total Observed Frequencies 642 364 474 540 333 381 2734 Expected Proportion 0.24 0.13 0.16 0.20 0.13 0.14 State the hypotheses. Ho: The observed frequencies are Ⓒ consistent with the distribution of colors for M&M candies. consistent with the distribution of colors for M&M candies. Ha: The observed frequencies are not Calculate the x² test statistic. Round expected values to two decimal places. Round x² to three decimal places. x² = Calculate the p-value. Round to four decimal places. p-value = State your decision. Since p-value?a, Select an answer Ho. Interpret the results. At the 10% signficance level there Select an answer enough evidence to conclude that the observed frequencies Select an answer consistent with the distribution of colors for M&M candies. Submit Question MacBook Pro
Blue Brown Green Orange Red Yellow Total Observed Frequencies 642 364 474 540 333 381 2734 Expected Proportion 0.24 0.13 0.16 0.20 0.13 0.14 State the hypotheses. Ho: The observed frequencies are Ⓒ consistent with the distribution of colors for M&M candies. consistent with the distribution of colors for M&M candies. Ha: The observed frequencies are not Calculate the x² test statistic. Round expected values to two decimal places. Round x² to three decimal places. x² = Calculate the p-value. Round to four decimal places. p-value = State your decision. Since p-value?a, Select an answer Ho. Interpret the results. At the 10% signficance level there Select an answer enough evidence to conclude that the observed frequencies Select an answer consistent with the distribution of colors for M&M candies. Submit Question MacBook Pro

Algebra & Trigonometry with Analytic Geometry
13th Edition
ISBN:9781133382119
Author:Swokowski
Publisher:Swokowski
Chapter10: Sequences, Series, And Probability
Section10.8: Probability
Problem 32E

Related questions
Question
100%
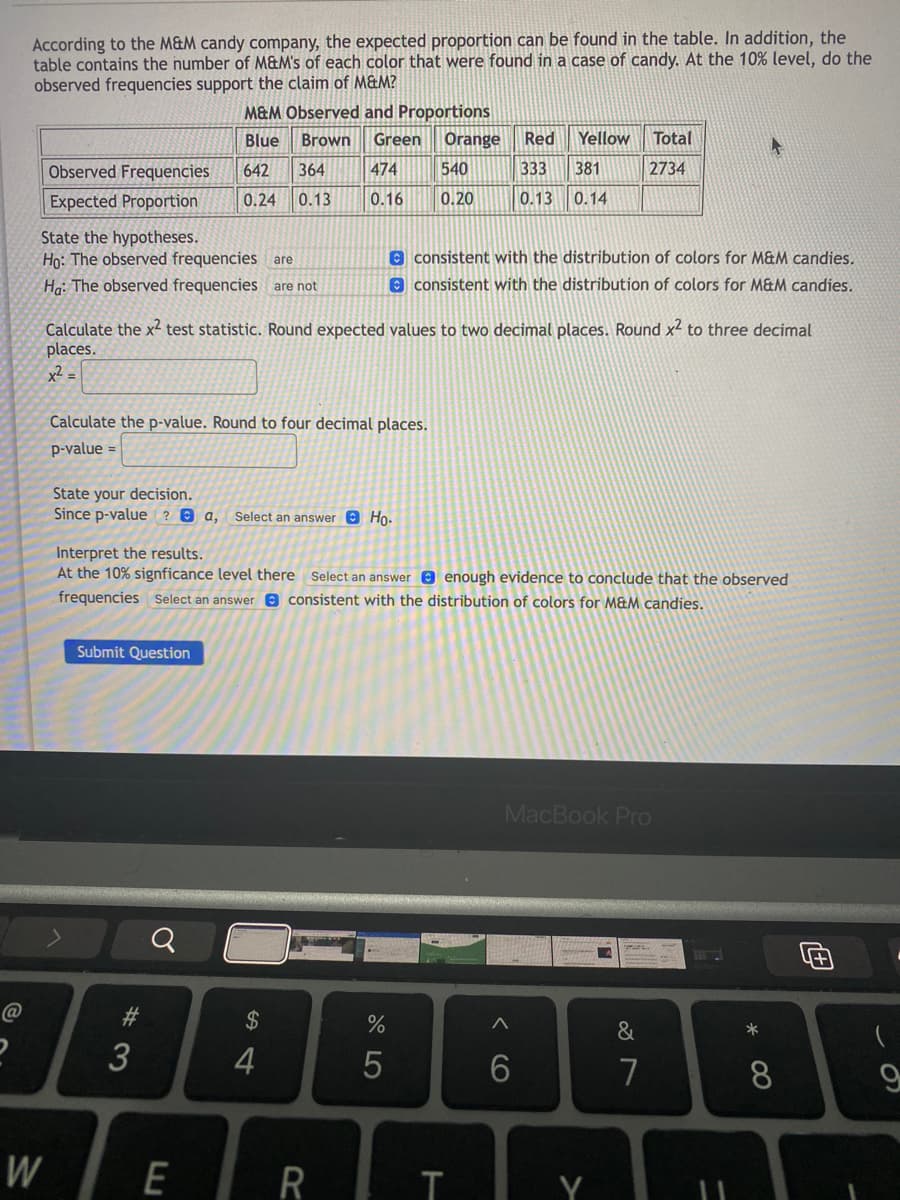
Transcribed Image Text:According to the M&M candy company, the expected proportion can be found in the table. In addition, the
table contains the number of M&M's of each color that were found in a case of candy. At the 10% level, do the
observed frequencies support the claim of M&M?
M&M Observed and Proportions
Brown Green
Blue
Orange Red
Yellow
Total
474
540
333
381
2734
Observed Frequencies 642 364
0.24 0.13 0.16
0.20
Expected Proportion
0.13 0.14
State the hypotheses.
Ho: The observed frequencies are
consistent with the distribution of colors for M&M candies.
consistent with the distribution of colors for M&M candies.
Ha: The observed frequencies are not
Calculate the x² test statistic. Round expected values to two decimal places. Round x² to three decimal
places.
x² =
Calculate the p-value. Round to four decimal places.
p-value =
State your decision.
Since p-value?a,
Select an answer Ho.
Interpret the results.
At the 10% signficance level there Select an answer enough evidence to conclude that the observed
frequencies Select an answer consistent with the distribution of colors for M&M candies.
Submit Question
MacBook Pro
Q
@
#
$
A
&
188
3
4
6
7
W
E
R
%
5
T
Y
11
*
8
4+1
(
9
Expert Solution
This question has been solved!
Explore an expertly crafted, step-by-step solution for a thorough understanding of key concepts.

Step by step
Solved in 2 steps with 2 images

Recommended textbooks for you
Algebra & Trigonometry with Analytic Geometry
Algebra
ISBN:
9781133382119
Author:
Swokowski
Publisher:
Cengage

Holt Mcdougal Larson Pre-algebra: Student Edition…
Algebra
ISBN:
9780547587776
Author:
HOLT MCDOUGAL
Publisher:
HOLT MCDOUGAL
Algebra & Trigonometry with Analytic Geometry
Algebra
ISBN:
9781133382119
Author:
Swokowski
Publisher:
Cengage
Holt Mcdougal Larson Pre-algebra: Student Edition…
Algebra
ISBN:
9780547587776
Author:
HOLT MCDOUGAL
Publisher:
HOLT MCDOUGAL