Boxplot of Oxygen Saturation (%) 100 90

Glencoe Algebra 1, Student Edition, 9780079039897, 0079039898, 2018
18th Edition
ISBN:9780079039897
Author:Carter
Publisher:Carter
Chapter10: Statistics
Section10.3: Measures Of Spread
Problem 1GP

Related questions
Question
Transcribed Image Text:Coaborate
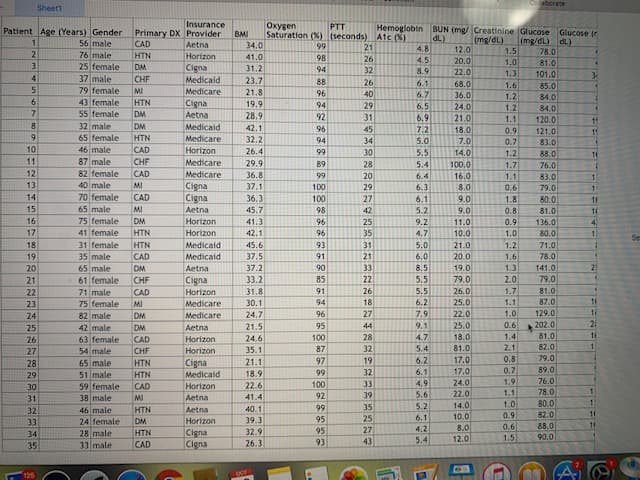
Sheett
Insurance
Primary DX Provider
Aetna
Oxygen
Saturation (%) (seconds) A1c (X)
34.0
PTT
Patient Age (Years) Gender
56 male
76 male
25 female
Hemoglobin BUN (mg/ Creatinine Glucose
(mg/dl) dL)
78.0
81.0
101.0
BMI
Glucose (r
1.
dL)
(mg/dL)
CAD
21
4.8
12.0
1.5
HTN
Horizon
41.0
98
26
4.5
20.0
22.0
1.0
DM
Cigna
Medicaid
Medicare
31.2
94
32
8.9
1.3
3-
37 male
79 female
4
CHF
23.7
21.8
88
26
6.1
68.0
1.6
85.0
MI
96
40
6.7
36.0
1.2
84.0
6.
43 female
HTN
Cigna
Aetna
19.9
94
29
6.5
24.0
21.0
1.2
84.0
7.
55 female
DM
28.9
92
31
6.9
120.0
121.0
83.0
88.0
76.0
83.0
79.0
80.0
1.1
32 male
DM
Medicaid
42.1
96
45
7.2
18.0
0.9
11
65 female
46 male
87 male
82 female
HTN
Medicare
32.2
94
34
5.0
7.0
0.7
10
CAD
Horizon
26.4
99
30
5.5
14.0
1.2
11
11
CHF
Medicare
29.9
89
28
5.4
100.0
1.7
12
CAD
Medicare
36.8
99
20
6.4
16.0
1.1
13
40 male
MI
Cigna
Cigna
37.1
100
29
6.3
8.0
0.6
70 female
65 male
14
CAD
36.3
100
27
6.1
9.0
1.8
11
15
MI
Aetna
45.7
98
42
5.2
9.0
0.8
81.0
11
16
17
75 female
DM
Horizon
41.3
96
25
9.2
11.0
0.9
136.0
4.
41 female
HTN
Horizon
42.1
96
35
4.7
10.0
1.0
80.0
18
31 female
HTN
Medicaid
Medicaid
45.6
93
31
5.0
6.0
21.0
1.2
71.0
78.0
141.0
19
35 male
CAD
37.5
91
21
20.0
1.6
20
65 male
DM
Aetna
37.2
90
33
8.5
19.0
1.3
25
21
61 female
CHF
Cigna
33.2
85
22
5.5
79.0
2.0
79.0
31.8
91
26
5.5
26.0
25.0
22
71 male
CAD
Horizon
1.7
81.0
94
18
6.2
1.1
87.0
10
Medicare
Medicare
23
75 female
MI
30.1
1.0
0.6
24
82 male
DM
24.7
96
27
7.9
22.0
129.0
25
42 male
DM
Aetna
21.5
95
44
9.1
25.0
202.0
21
63 female
100
28
4.7
18.0
1.4
81.0
11
Horizon
Horizon
Cignal
Medicaid
26
CAD
24.6
27
54 male
CHF
35.1
87
32
5.4
81.0
2.1
82.0
97
19
6.2
17.0
0.8
79.0
21.1
18.9
28
65 male
HTN
51 male
HTN
99
32
6.1
17.0
0.7
89.0
29
59 female
CAD
Horizon
22.6
100
33
4.9
24.0
1.9
76.0
30
92
39
5.6
22.0
1.1
78.0
31
38 male
MI
Aetna
41.4
35
5.2
14.0
1.0
80.0
32
46 male
HTN
Aetna
40.1
99
95
25
6.1
10.0
0.9
82.0
33
24 female
DM
Horizon
39.3
88.0
90.0
32.9
95
27
4.2
8.0
0.6
28 male
33 male
Cigna
Cigna
34
HTN
93
43
5.4
12.0
1.5
35
CAD
26.3
125
OCT
8591 NSG2 OS
000unin2 9174r 219 oNT NT
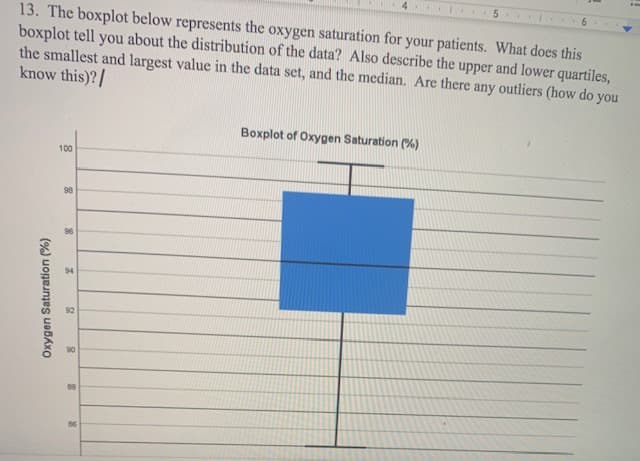
Transcribed Image Text:13. The boxplot below represents the oxygen saturation for your patients. What does this
boxplot tell you about the distribution of the data? Also describe the upper and lower quartiles,
the smallest and largest value in the data set, and the median. Are there any outliers (how do you
know this)?/
Boxplot of Oxygen Saturation (%)
100
98
94
92
88
86
Oxygen Saturation (%)
Expert Solution
This question has been solved!
Explore an expertly crafted, step-by-step solution for a thorough understanding of key concepts.

This is a popular solution!

Trending now
This is a popular solution!

Step by step
Solved in 2 steps

Knowledge Booster


Learn more about
Need a deep-dive on the concept behind this application? Look no further. Learn more about this topic, statistics and related others by exploring similar questions and additional content below.Recommended textbooks for you
Glencoe Algebra 1, Student Edition, 9780079039897…
Algebra
ISBN:
9780079039897
Author:
Carter
Publisher:
McGraw Hill
Glencoe Algebra 1, Student Edition, 9780079039897…
Algebra
ISBN:
9780079039897
Author:
Carter
Publisher:
McGraw Hill