boxplot of some data is as follows. 20 40 60 30 100 120 Using this boxplot, answer the following questions. What is the lower quartile? What is the upper quartile? Choose... Choose... Is the boxplot left-skew, symmetric or right-skew? Choose...
boxplot of some data is as follows. 20 40 60 30 100 120 Using this boxplot, answer the following questions. What is the lower quartile? What is the upper quartile? Choose... Choose... Is the boxplot left-skew, symmetric or right-skew? Choose...

Glencoe Algebra 1, Student Edition, 9780079039897, 0079039898, 2018
18th Edition
ISBN:9780079039897
Author:Carter
Publisher:Carter
Chapter10: Statistics
Section10.4: Distributions Of Data
Problem 19PFA

Related questions
Question
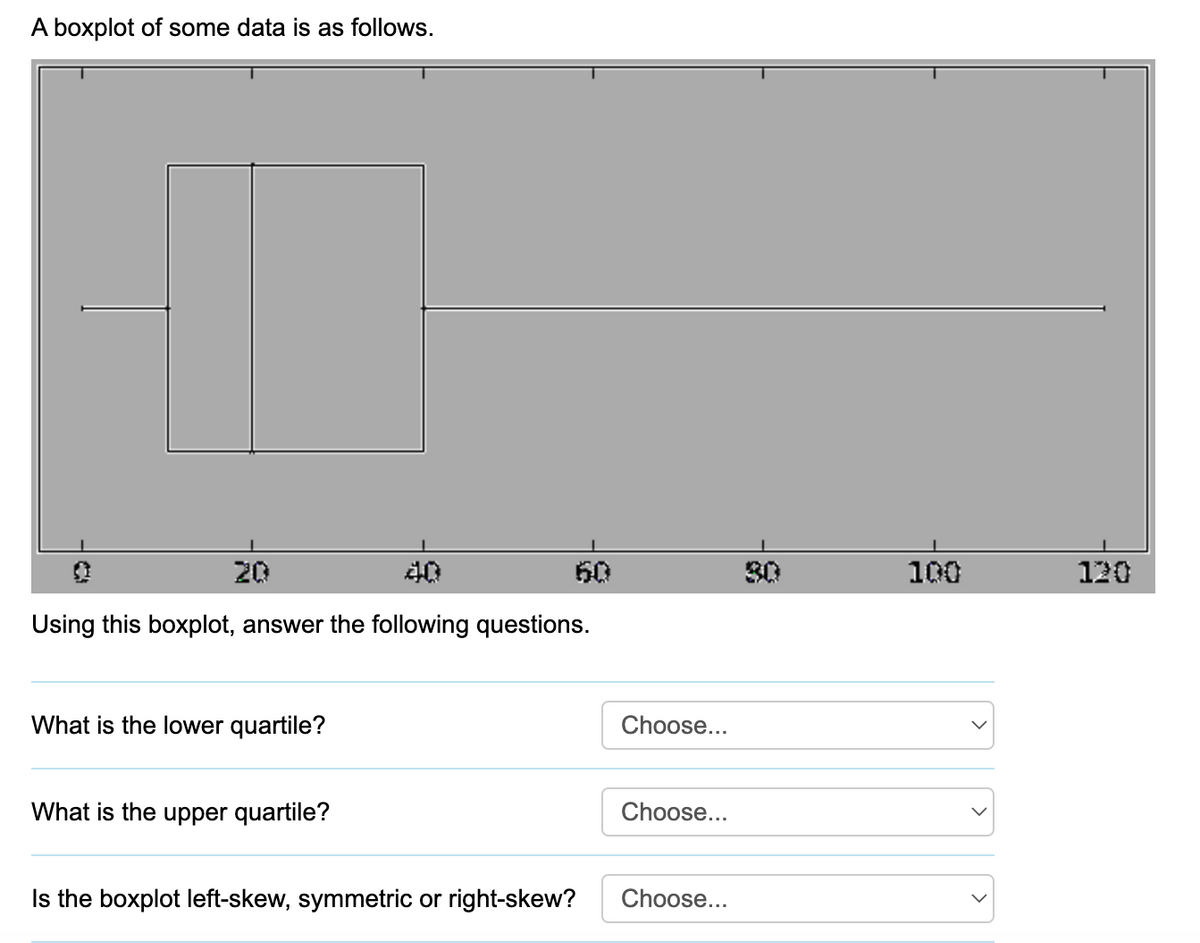
Transcribed Image Text:A boxplot of some data is as follows.
20
40
60
50
100
120
Using this boxplot, answer the following questions.
What is the lower quartile?
What is the upper quartile?
Choose...
Choose...
Is the boxplot left-skew, symmetric or right-skew? Choose...
Expert Solution
This question has been solved!
Explore an expertly crafted, step-by-step solution for a thorough understanding of key concepts.

Step by step
Solved in 3 steps with 2 images

Recommended textbooks for you
Glencoe Algebra 1, Student Edition, 9780079039897…
Algebra
ISBN:
9780079039897
Author:
Carter
Publisher:
McGraw Hill
Glencoe Algebra 1, Student Edition, 9780079039897…
Algebra
ISBN:
9780079039897
Author:
Carter
Publisher:
McGraw Hill