
Chapter28: Nutrition And Physical Performance
Section: Chapter Questions
Problem 7RQ

Related questions

Question
Briefly interpret the graphs about Comparisons of prey toxicity and predator resistance from two localities?
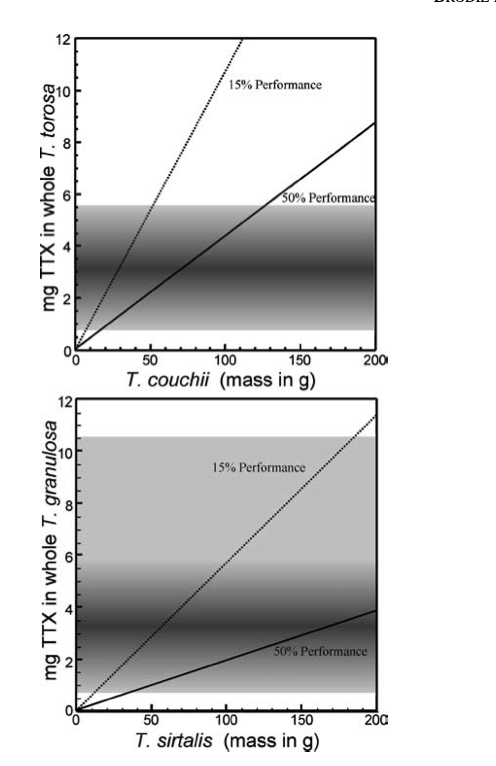
Transcribed Image Text:12
O
mg TTX in whole T. torosa
8
CO
CO
mg TTX in whole T. granulosa
15% Performance
50% Performance
50
100
150
T. couchii (mass in g)
15% Performance
200
50% Performance
50
100
150
T. sirtalis (mass in g)
200
Expert Solution
This question has been solved!
Explore an expertly crafted, step-by-step solution for a thorough understanding of key concepts.

Step by step
Solved in 2 steps

Knowledge Booster


Learn more about
Need a deep-dive on the concept behind this application? Look no further. Learn more about this topic, biology and related others by exploring similar questions and additional content below.Recommended textbooks for you