bu are investigating the link between the number of customers visiting a website (X) and the number of roducts sold (Y). You get the following results in Excel: Sales vs Visitors 100 95 90 85 80 75 70 y= 0.0088x + 18.48 R=0.7026 65 60 55 50 5000 5500 6000 6500 7000 7500 8000 8500 Visitors ) What is the slope of the regression line? (see information in the picture - quation located below the regression line) ) Write the regression equation, y = quation located below the regression line) (see information in the picture - :) If the website has 6,000 visitors this month, how many sales per month would you expect? Sales
bu are investigating the link between the number of customers visiting a website (X) and the number of roducts sold (Y). You get the following results in Excel: Sales vs Visitors 100 95 90 85 80 75 70 y= 0.0088x + 18.48 R=0.7026 65 60 55 50 5000 5500 6000 6500 7000 7500 8000 8500 Visitors ) What is the slope of the regression line? (see information in the picture - quation located below the regression line) ) Write the regression equation, y = quation located below the regression line) (see information in the picture - :) If the website has 6,000 visitors this month, how many sales per month would you expect? Sales

Chapter4: Linear Functions
Section: Chapter Questions
Problem 30PT: For the following exercises, use Table 4 which shows the percent of unemployed persons 25 years or...

Related questions
Question
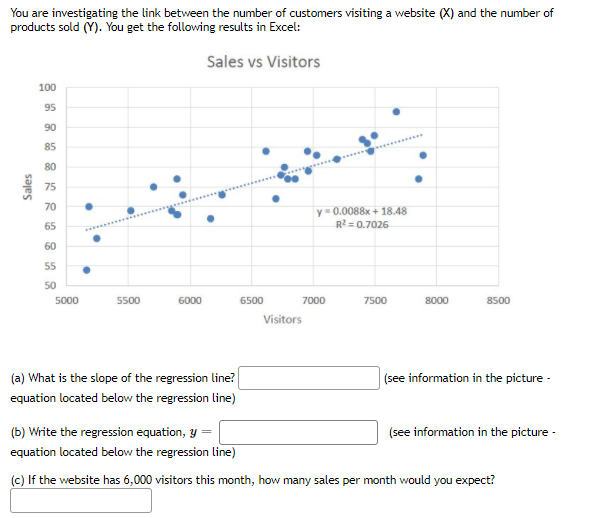
Transcribed Image Text:You are investigating the link between the number of customers visiting a website (X) and the number of
products sold (Y). You get the following results in Excel:
Sales vs Visitors
100
95
90
85
80
75
70
y = 0.0088x + 18.48
R2 = 0.7026
65
60
55
50
5000
5500
6000
6500
7000
7500
8000
8500
Visitors
(a) What is the slope of the regression line?
(see information in the picture -
equation located below the regression line)
(b) Write the regression equation, y =
(see information in the picture -
equation located below the regression line)
(c) If the website has 6,000 visitors this month, how many sales per month would you expect?
Sales
Expert Solution
This question has been solved!
Explore an expertly crafted, step-by-step solution for a thorough understanding of key concepts.

This is a popular solution!

Trending now
This is a popular solution!

Step by step
Solved in 2 steps with 2 images

Recommended textbooks for you

Algebra & Trigonometry with Analytic Geometry
Algebra
ISBN:
9781133382119
Author:
Swokowski
Publisher:
Cengage

College Algebra
Algebra
ISBN:
9781305115545
Author:
James Stewart, Lothar Redlin, Saleem Watson
Publisher:
Cengage Learning
Algebra & Trigonometry with Analytic Geometry
Algebra
ISBN:
9781133382119
Author:
Swokowski
Publisher:
Cengage
College Algebra
Algebra
ISBN:
9781305115545
Author:
James Stewart, Lothar Redlin, Saleem Watson
Publisher:
Cengage Learning

Trigonometry (MindTap Course List)
Trigonometry
ISBN:
9781305652224
Author:
Charles P. McKeague, Mark D. Turner
Publisher:
Cengage Learning

Algebra and Trigonometry (MindTap Course List)
Algebra
ISBN:
9781305071742
Author:
James Stewart, Lothar Redlin, Saleem Watson
Publisher:
Cengage Learning

Functions and Change: A Modeling Approach to Coll…
Algebra
ISBN:
9781337111348
Author:
Bruce Crauder, Benny Evans, Alan Noell
Publisher:
Cengage Learning