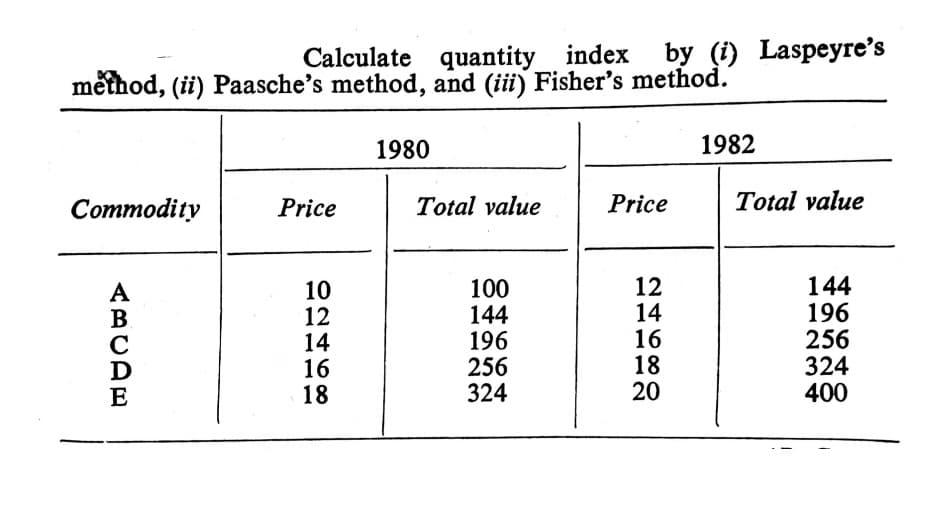
by (i) Laspeyre's Calculate quantity index method, (ii) Paasche's method, and (iii) Fisher's method." 1980 1982 Commodity Price Total value Price Total value 10 12 14 16 18 100 144 196 256 324 12 14 16 18 20 144 196 256 324 400 ABCAE


Q: Problem 7. Calculate Inter quartile Range for the data given below : Class : 0-10 10-20 20-30 30-40 ...
A:
Q: Test the claim about the population mean, p, at the given level of significance using the given samp...
A:
Q: Q9. A Random Variable X has an unknown distribution, a known mean of 10 and an unknown variance, o. ...
A:
Q: Sara draws the 10 of hearts from a standard deck of 52 cards. Without replacing the first card, she ...
A: Explanation:Here given the 10 hearts deck of 52 cards then proceeds to draw a second card The pro...
Q: Example What is the probability of drawing a black card or a king from a well-shuffled pack of playi...
A: We know that There are 52 card in the deck in which they divided into two color i.e red(26) and blac...
Q: 4. A study was conducted among men in the United States in order to find out whether a mother’s use ...
A: Given information: Mothers had used hormones Mothers had not used hormones Sum Testicular can...
Q: A famous Chinese restaurant would like to find out the change in demand on its dim-sum. After checki...
A:
Q: Two different types of injection-molding machines are used to form plastic parts. A part is consider...
A: Given data X1 = 15 X2= 8 N1 and N2 = 300 P1 = 0.05,. P2 = 0.01
Q: p= proportion of motorists who check their cell phones while driving A traffic officer believes that...
A: Solution: Given that: p= 0.50 Population proportion of motorists who check their cell phones whil...
Q: The following data represent the concentration of dissolved organic carbon (mg/L) collected from 20...
A:
Q: The P-value for a hypothesis test is shown. Use the P-value to decide whether to reject Ho when the ...
A:
Q: An article in American Demographics claims that more than twice as many shoppers are out shopping on...
A: Let X be the random variable from normal distribution with mean (μ) = $180 and standard deviation (σ...
Q: 4. Suppose Y,, Y Y, is an iid sample from a N(u, o') population distribution. Let Y and S' denote th...
A: We want to find the pdf of Q12+Q2
Q: Consider the following time series. t 1 2 3 4 5 6 7 121 111 105 99 95 93 89 (a) Construct a time ser...
A:
Q: A study on the time spent weekly on online games of sample students and their final exam scores. The...
A: Note: According to Bartleby expert guidelines, we can answer only first question with their three su...
Q: (b) Use a multiple regression model with dummy variables as follows to develop an equation to accoun...
A:
Q: From 5 statisticians and 6 economists, a committee of size 6 is to be formed. How many different com...
A: From 5 statisticians and 6 economists, a committee of size 6 is to be formed. How many different com...
Q: Find the probability that in a family of 4 children there will be (a) at least1 boy and (b) at least...
A:
Q: A math class consists of 21 female students and 15 male students. Two students are selected at rando...
A:
Q: The number of pets owned by twelve randomly chosen students are 0, 0, 1, 3, 14, 1, 2, 2, 0, 1, 2, 1...
A:
Q: A study was conducted among men in the United States in order to find out whether a mother’s use of ...
A: Given information: Mothers had used hormones Mothers had not used hormones Sum Testicular can...
Q: Consider the following time series data. 2 34 5 1 7 12 8. 13 16 (a) Construct a time series plot. Wh...
A: Solution-: Given data: (a) Construct a time series plot. What type of pattern exists in the data? (b...
Q: The Airline Passenger Association studied the relationship between the number of passengers on a par...
A:
Q: A local chess club claims that the length of time to play a game has a standard deviation of less th...
A: For the given statement write type 1 and type 2 error
Q: Assume the random variable X is normally distributed with mean u = 50 and standard deviation o = 7. ...
A:
Q: 13.12. From some given data, the consumer price index based on 5 groups was calculated as 205. Ths p...
A:
Q: The random-number generator on calculators randomly generates a number between 0 and 1. The random v...
A:
Q: dy evaluate dx X +5 If y = %3D 2 - 2x + 3 -
A:
Q: Find the critical value(s) and rejection region(s) for the type of z-test with level of significance...
A:
Q: Consider the following time series data. Month 1 2 3 4 5 Value 25 12 19 13 18 24 16 (a) Compute MSE ...
A:
Q: Tollowing data on clothing prices, show that the arithmetic mean of relatives (unweighted) does not ...
A:
Q: The following are the lengths of stay (in days) for a random sample of 15 patients discharged from a...
A:
Q: Two different types of injection-molding machines are used to form plastic parts. A part is consider...
A:
Q: In a study examining the effects of time of day (morning or afternoon) and temperature (cool, no...
A: Interaction effects : The role of a variable in an estimated model and its effect on the dependent v...
Q: (c) Suppose the manager agrees to pay each employee a $50 bonus if they meet a certain goal. On a ty...
A:
Q: Given the u = 27 and o = 7, compute the z-score that corresponds to the given score X = 44. Round yo...
A:
Q: - In how many ways can you arrange the letters in the word RHOMBUS?
A: Solution: 1. The word RHOMBUS has 7 letters.
Q: You are given the sample mean and the population standard deviation. Use this information to constru...
A:
Q: Days Sick Monday 365 Tuesday 270 Wednesday 300 Thursday 300 F...
A: Chi-square test : Pearson's chi-squared test and its variants Pearson's chi-squared test is used to ...
Q: In a trivariate distribution: 01 = 3, 02 = 4, 03 = 5 123 = 0-4, r31 = 0-6, 13 = 0-7 %3D Determine th...
A:
Q: The population proportion is 0.55. what is the probability that a sample proportion will be within 0...
A: Disclaimer : “Since you have posted a question with multiple sub-parts, we will solve first three s...
Q: Approximately _% of the area under the normal curve is between u- o and u+ o. 95 68 50 99.7 O O O O
A:
Q: Draw a normal curve with u= 57 and o = 15. Label the mean and the inflection points. Choose the corr...
A: We have give that μ = 57, and σ = 15
Q: proportion of motorists who consult their cell phone while driving A traffic officer believes that ...
A: From the given information we conduct the test for one proportion.
Q: Rockwell hardness of pins of a certain type is known to have a mean value of 50 and a standard devia...
A:
Q: For a hypothesis test of the claim that the mean amount mean is 6.5 hours of sleep. Interpret this v...
A: Given : Power = 0.4506
Q: Activity No. 2: Read and Answer the following questions. 1. A psychologist found in her study that t...
A: As a phycologist found, There is no correlation between person's happiness and the amount of money h...
Q: A random sample of 80 eighth grade students' scores on a national mathematics assessment test has a ...
A:
Q: Let {Xi} be i.i.d.∼ Exp(θ) and ai > 0. Denote by Z = min{a1X1, . . . , anXn}. Suppose that sum 1/ai ...
A:
Q: A company claims that the mean monthly residential electricity consumption in a certain region is mo...
A:

Step by step
Solved in 3 steps with 3 images

- Urban Travel Times Population of cities and driving times are related, as shown in the accompanying table, which shows the 1960 population N, in thousands, for several cities, together with the average time T, in minutes, sent by residents driving to work. City Population N Driving time T Los Angeles 6489 16.8 Pittsburgh 1804 12.6 Washington 1808 14.3 Hutchinson 38 6.1 Nashville 347 10.8 Tallahassee 48 7.3 An analysis of these data, along with data from 17 other cities in the United States and Canada, led to a power model of average driving time as a function of population. a Construct a power model of driving time in minutes as a function of population measured in thousands b Is average driving time in Pittsburgh more or less than would be expected from its population? c If you wish to move to a smaller city to reduce your average driving time to work by 25, how much smaller should the city be?The economic dynamism, which is the index of productive growth (in dollars) for countries that are designated by the World Bank as middle-income are in following table ("SOCR data 2008," 2013): Table: Economic Dynamism ($) of Middle Income Countries 25.8057 37.4511 51.915 43.6952 47.8506 43.7178 58.0767 41.1648 38.0793 37.7251 39.6553 42.0265 48.6159 43.8555 49.1361 61.9281 41.9543 44.9346 46.0521 48.3652 43.6252 50.9866 59.1724 39.6282 33.6074 21.6643 Compute a 95% confidence interval for the mean economic dynamism of middle-income countries by answering the following questions: (i) Determine sample mean x :i Determine sample mean x : Enter in decimal form to nearest ten-thousandth. Do not enter units of measure. Examples of correctly entered answers: 0.0015 0.0000 136.7000 99.0070 36.9128 (ii) Determine sample standard deviation s : Enter in decimal form to nearest ten-thousandth. Examples of correctly entered answers: 0.0001…The economic dynamism, which is the index of productive growth (in dollars) for countries that are designated by the World Bank as middle-income are in following table ("SOCR data 2008," 2013). Table: Economic Dynamism of Middle Income Countries 25.8057 37.4511 51.915 43.6952 47.8506 43.7178 58.0767 41.1648 38.0793 37.7251 39.6553 42.0265 48.6159 43.8555 49.1361 61.9281 41.9543 44.9346 46.0521 48.3652 43.6252 50.9866 59.1724 39.6282 33.6074 21.6643 Countries that are considered high-income have a mean economic dynamism of 60.29. Do the data show that the mean economic dynamism of middle-income countries is less than the mean for high-income countries? Test at the 5% level. (iv) Determine sample mean x :iv Determine sample mean x : Enter answer to nearest ten-thousandth, without "$" sign. Examples of correctly entered answers: 11.2385 0.0079 3.0500 7.4000 (v) Determine sample…
- The economic dynamism, which is the index of productive growth (in dollars) for countries that are designated by the World Bank as middle-income are in following table ("SOCR data 2008," 2013). Table: Economic Dynamism of Middle Income Countries 25.8057 37.4511 51.915 43.6952 47.8506 43.7178 58.0767 41.1648 38.0793 37.7251 39.6553 42.0265 48.6159 43.8555 49.1361 61.9281 41.9543 44.9346 46.0521 48.3652 43.6252 50.9866 59.1724 39.6282 33.6074 21.6643 Countries that are considered high-income have a mean economic dynamism of 60.29. Do the data show that the mean economic dynamism of middle-income countries is less than the mean for high-income countries? Test at the 5% level. (i) Which of the following statements correctly defines the null hypothesis HO? A. μ < $60.29 B. p < $60.29 C. μ = $60.29 D. p = $60.29 Enter letter corresponding to correct answer (ii) Which of the following…The economic dynamism, which is the index of productive growth (in dollars) for countries that are designated by the World Bank as middle-income are in following table ("SOCR data 2008," 2013): Table: Economic Dynamism ($) of Middle Income Countries 25.8057 37.4511 51.915 43.6952 47.8506 43.7178 58.0767 41.1648 38.0793 37.7251 39.6553 42.0265 48.6159 43.8555 49.1361 61.9281 41.9543 44.9346 46.0521 48.3652 43.6252 50.9866 59.1724 39.6282 33.6074 21.6643 Compute a 95% confidence interval for the mean economic dynamism of middle-income countries by answering the following questions (iv) Determine t score corresponding to desired confidence level Enter value in decimal form rounded to nearest hundredth. Examples of correctly entered answers: 2.01 0.37 0.60 0.00 (v) Determine error bound of the mean: Enter value in decimal form rounded to nearest ten-thousandth. Examples of correctly entered answers: 0.0000 0.0003 3.0060 2.0700…The economic dynamism, which is the index of productive growth (in dollars) for countries that are designated by the World Bank as middle-income are in following table ("SOCR data 2008," 2013): Table: Economic Dynamism ($) of Middle Income Countries 25.8057 37.4511 51.915 43.6952 47.8506 43.7178 58.0767 41.1648 38.0793 37.7251 39.6553 42.0265 48.6159 43.8555 49.1361 61.9281 41.9543 44.9346 46.0521 48.3652 43.6252 50.9866 59.1724 39.6282 33.6074 21.6643 Compute a 95% confidence interval for the mean economic dynamism of middle-income countries by answering the following questions: (vii) Using the confidence interval, select the correct description of the result of the survey: A. We estimate with 95% confidence that the true proportion mean economic dynamism for middle-income countries is between $40.21 and $47.54. B. We estimate with 95% confidence that the proportional economic dynamism for middle-income countries is between $40.21 and $47.54. C. We estimate…
- The economic dynamism, which is the index of productive growth (in dollars) for countries that are designated by the World Bank as middle-income are in following table ("SOCR data 2008," 2013). Table: Economic Dynamism of Middle Income Countries 25.8057 37.4511 51.915 43.6952 47.8506 43.7178 58.0767 41.1648 38.0793 37.7251 39.6553 42.0265 48.6159 43.8555 49.1361 61.9281 41.9543 44.9346 46.0521 48.3652 43.6252 50.9866 59.1724 39.6282 33.6074 21.6643 Countries that are considered high-income have a mean economic dynamism of 60.29. Do the data show that the mean economic dynamism of middle-income countries is less than the mean for high-income countries? Test at the 5% level. (x) Select the statement that most correctly interprets the result of this test: A. The result is statistically significant at .05 level of significance. Evidence supports the claim that the mean economic dynamism for a middle-income…The economic dynamism, which is the index of productive growth (in dollars) for countries that are designated by the World Bank as middle-income are in following table ("SOCR data 2008," 2013). Table: Economic Dynamism of Middle Income Countries 25.8057 37.4511 51.915 43.6952 47.8506 43.7178 58.0767 41.1648 38.0793 37.7251 39.6553 42.0265 48.6159 43.8555 49.1361 61.9281 41.9543 44.9346 46.0521 48.3652 43.6252 50.9866 59.1724 39.6282 33.6074 21.6643 Countries that are considered high-income have a mean economic dynamism of 60.29. Do the data show that the mean economic dynamism of middle-income countries is less than the mean for high-income countries? Test at the 5% level. (vii) Calculate and enter test statistic Enter value in decimal form rounded to nearest ten-thousandth, with appropriate sign (no spaces). Examples of correctly entered answers: –2.0140 –0.0307 +0.6000 +1.0009…Isle Royale, an island in Lake Superior, has provided an important study site of wolves and their prey. Of special interest is the study of the number of moose killed by wolves. In the period from 1958 to 1974, there were 296 moose deaths identified as wolf kills. The age distribution of the kills is as follows. Age of Moose in Years Number Killed by Wolves Calf (0.5 yr)1-56-1011-1516-20 1114579574 (a) For each age group, compute the probability that a moose in that age group is killed by a wolf. (Round your answers to four decimal places.) 0.5 1-5 6-10 11-15 16-20 (b) Consider all ages in a class equal to the class midpoint. Find the expected age of a moose killed by a wolf and the standard deviation of the ages. (Round your answers to two decimal places.) ? = ? =
- Isle Royale, an island in Lake Superior, has provided an important study site of wolves and their prey. Of special interest is the study of the number of moose killed by wolves. In the period from 1958 to 1974, there were 296 moose deaths identified as wolf kills. The age distribution of the kills is as follows;Age of Moose in Years Calf (0.5 yr)1-56-1011-1516-20 Number Killed By Wolves1065179546 (a) For each age group, compute the probability that a moose in that age group is killed by a wolf. (Round your answers to three decimal places.)0.5 1-5 6-10 11-15 16-20 (b) Consider all ages in a class equal to the class midpoint. Find the expected age of a moose killed by a wolf and the standard deviation of the ages. (Round your answers to two decimal places.)μ = σ =A suburban hotel derives its revenue from its hotel and restaurant operations. Theowners are interested in the relationship between the number of rooms occupied on anightly basis and the revenue per day in the restaurant. Below is a sample of 25 days(Monday through Thursday) from last year showing the restaurant income and numberof rooms occupied.ABC Company has decided to use 20 test markets to examine the sensitivity of demand for its new product, Hand Sanitizer, to various prices, as shown in the following table. Each market had approximately the same level of business activity and population. Test Market Quantity sold (Thousands of Pens) Price Charged (cent) 1 20 50 2 21 50 3 19 55 4 18 60 5 20 60 6 14 65 7 16 65 8 20 70 9 12 70 10 14 80 11 12 70 12 10 70 13 14 65 14 16 90 15 18 45 16 16 70 17 20 65 18 12 80 19 18 70 20 10 50 Q.1. Using a linear regression model, estimate the demand function for ABC Company’s new product, Hand sanitizer. Q.2. Interpret the coefficient value of the independent variable of the estimated demand function. Q.3. What will be the predicted/estimated sale for each price shown in column 2? Q.4. Find the prediction interval at…