By letting the GDP (gross domestic product) be the dependent variable (y), and the year (2002 - 2021) be the independent variable (x), answer the following questions: (a) Based on the line graph of the two countries, comment on the significant features from the graphs (identify any unusual points, if any, and observe the trend line). Compare the results of the GDP in these two countries. (Pls refer to the table and line graph in the image attached below) (b) Determine the correlation between the GDP and year, and develop the estimated equation for Ethiopia and Germany. Refer to the summary output of the two countries in the image attached below and interpret the coefficient for the independent variable. Determine whether the regression model is significant at 1% significance level.
By letting the GDP (gross domestic product) be the dependent variable (y), and the year (2002 - 2021) be the independent variable (x), answer the following questions: (a) Based on the line graph of the two countries, comment on the significant features from the graphs (identify any unusual points, if any, and observe the trend line). Compare the results of the GDP in these two countries. (Pls refer to the table and line graph in the image attached below) (b) Determine the correlation between the GDP and year, and develop the estimated equation for Ethiopia and Germany. Refer to the summary output of the two countries in the image attached below and interpret the coefficient for the independent variable. Determine whether the regression model is significant at 1% significance level.

Elementary Linear Algebra (MindTap Course List)
8th Edition
ISBN:9781305658004
Author:Ron Larson
Publisher:Ron Larson
Chapter2: Matrices
Section2.CR: Review Exercises
Problem 89CR: Cellular Phone Subscribers The table shows the numbers of cellular phone subscribers y in millions...

Related questions
Question
By letting the GDP (gross domestic product) be the dependent variable (y), and the year (2002 - 2021) be the independent variable (x), answer the following questions:
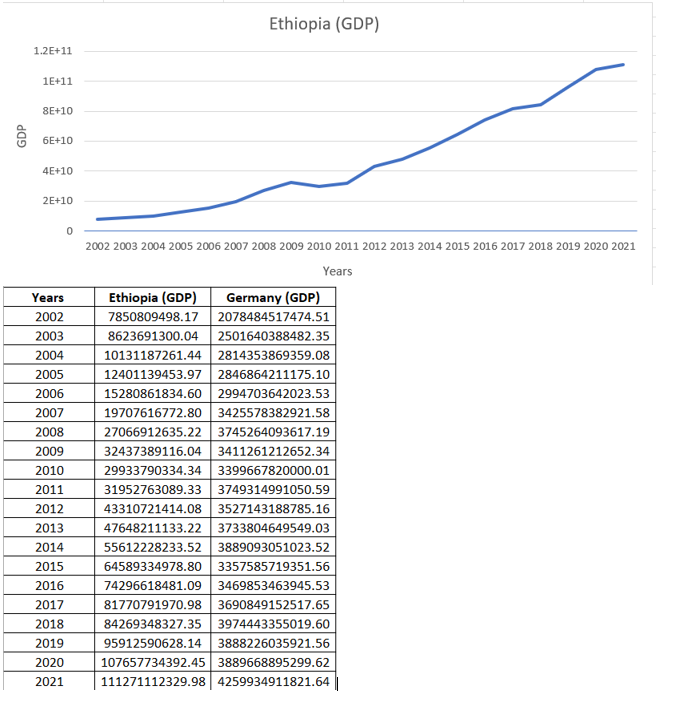
(a) Based on the line graph of the two countries, comment on the significant features from the graphs (identify any unusual points, if any, and observe the trend line). Compare the results of the GDP in these two countries.
(Pls refer to the table and line graph in the image attached below)
(b) Determine the correlation between the GDP and year, and develop the estimated
equation for Ethiopia and Germany. Refer to the summary
output of the two countries in the image attached below and interpret the coefficient for the independent variable. Determine whether the regression model is significant at 1% significance level.
equation for Ethiopia and Germany. Refer to the summary
output of the two countries in the image attached below and interpret the coefficient for the independent variable. Determine whether the regression model is significant at 1% significance level.
.
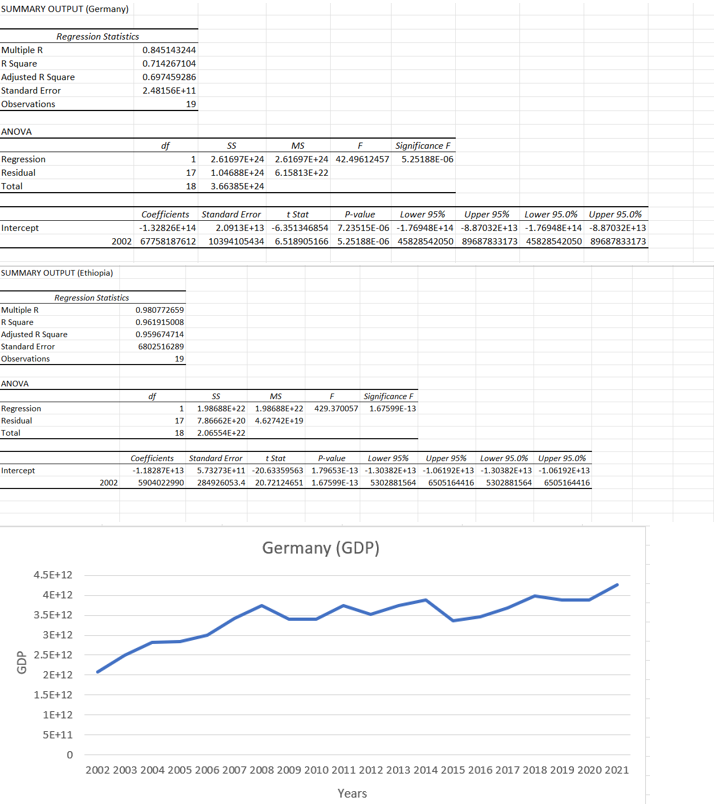
Transcribed Image Text:SUMMARY OUTPUT (Germany)
Multiple R
R Square
Adjusted R Square
Standard Error
Observations
ANOVA
Regression
Residual
Total
Intercept
Multiple R
R Square
SUMMARY OUTPUT (Ethiopia)
Regression Statistics
ANOVA
Adjusted R Square
Standard Error
Observations
Regression
Residual
Total
Intercept
Regression Statistics
4.5E+12
4E+12
3.5E+12
3E+12
2.5E+12
2E+12
1.5E+12
1E+12
5E+11
0
0.845143244
0.714267104
0.697459286
2.48156E+11
2002
df
Standard Error
Coefficients
t Stat
P-value Lower 95% Upper 95% Lower 95.0% Upper 95.0%
-1.32826E+14
-6.351346854 7.23515E-06 -1.76948E+14 -8.87032E+13 -1.76948E+14 -8.87032E+13
2002 67758187612 10394105434 6.518905166 5.25188E-06 45828542050 89687833173 45828542050 89687833173
2.0913E+13
0.980772659
0.961915008
0.959674714
6802516289
df
19
19
MS
F
SS
2.61697E+24 2.61697E+24 42.49612457
1
17 1.04688E+24 6.15813E+22
18 3.66385E+24
1
SS
MS
1.98688E+22 1.98688E +22
17 7.86662E+20 4.62742E+19
18 2.06554E+22
Significance F
5.25188E-06
F Significance F
429.370057 1.67599E-13
Coefficients Standard Error t Stat
P-value Lower 95%
-1.18287E+13 5.73273E+11 -20.63359563 1.79653E-13 -1.30382E+13
5904022990 284926053.4 20.72124651 1.67599E-13 5302881564 6505164416 5302881564 6505164416
Upper 95%
Lower 95.0% Upper 95.0%
-1.06192E+13 -1.30382E+13 -1.06192E+13
Germany (GDP)
2002 2003 2004 2005 2006 2007 2008 2009 2010 2011 2012 2013 2014 2015 2016 2017 2018 2019 2020 2021
Years
Transcribed Image Text:GDP
1.2E+11
1E+11
8E+10
6E+10
4E+10
2E+10
Years
2002
2003
2004
2005
2006
2007
2008
2009
2010
2011
2012
2013
2014
2015
2016
2017
2018
2019
2020
2021
0
Ethiopia (GDP)
2002 2003 2004 2005 2006 2007 2008 2009 2010 2011 2012 2013 2014 2015 2016 2017 2018 2019 2020 2021
Years
Ethiopia (GDP) Germany (GDP)
7850809498.17 2078484517474.51
8623691300.04 2501640388482.35
10131187261.44 2814353869359.08
12401139453.97
2846864211175.10
15280861834.60 2994703642023.53
19707616772.80
3425578382921.58
27066912635.22 3745264093617.19
32437389116.04
3411261212652.34
29933790334.34
3399667820000.01
31952763089.33 3749314991050.59
43310721414.08
3527143188785.16
47648211133.22 3733804649549.03
55612228233.52 3889093051023.52
64589334978.80
3357585719351.56
74296618481.09 3469853463945.53
81770791970.98 3690849152517.65
84269348327.35 3974443355019.60
95912590628.14 3888226035921.56
107657734392.45 3889668895299.62
111271112329.98 4259934911821.64
Expert Solution
This question has been solved!
Explore an expertly crafted, step-by-step solution for a thorough understanding of key concepts.

Step by step
Solved in 3 steps

Recommended textbooks for you
Elementary Linear Algebra (MindTap Course List)
Algebra
ISBN:
9781305658004
Author:
Ron Larson
Publisher:
Cengage Learning


Functions and Change: A Modeling Approach to Coll…
Algebra
ISBN:
9781337111348
Author:
Bruce Crauder, Benny Evans, Alan Noell
Publisher:
Cengage Learning
Elementary Linear Algebra (MindTap Course List)
Algebra
ISBN:
9781305658004
Author:
Ron Larson
Publisher:
Cengage Learning
Functions and Change: A Modeling Approach to Coll…
Algebra
ISBN:
9781337111348
Author:
Bruce Crauder, Benny Evans, Alan Noell
Publisher:
Cengage Learning