C= 40 + 0.75 (Y-T), I-80, G=50, and T=60 Imports and exports are given by: IM =0.25Y and X-0.3Y* Foreign income (Y*) =700 a) Solve for equilibrium output in the domestic economy. (10 points) b) Solve for the trade balance. Does the country have a trade surplus or deficit? How much? (5) c) Draw representative graphs of the goods market and net-exports. Draw your graphs to illustrate the trade balance at the equilibrium level of output. (10) d) What happens to equilibrium output and the trade balance if government expenditures increase to 100? Show the impact of this change on the graphs that you drew in part c. (10)
C= 40 + 0.75 (Y-T), I-80, G=50, and T=60 Imports and exports are given by: IM =0.25Y and X-0.3Y* Foreign income (Y*) =700 a) Solve for equilibrium output in the domestic economy. (10 points) b) Solve for the trade balance. Does the country have a trade surplus or deficit? How much? (5) c) Draw representative graphs of the goods market and net-exports. Draw your graphs to illustrate the trade balance at the equilibrium level of output. (10) d) What happens to equilibrium output and the trade balance if government expenditures increase to 100? Show the impact of this change on the graphs that you drew in part c. (10)
Chapter4: The Aggregate Economy
Section: Chapter Questions
Problem 5E
Related questions
Question

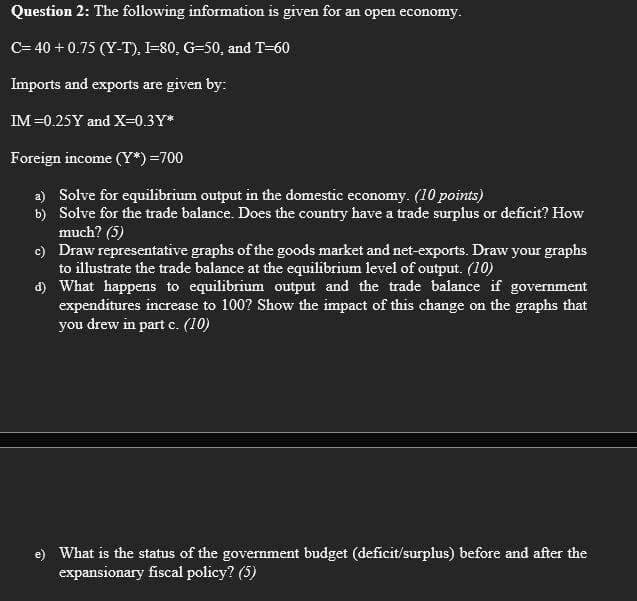
Transcribed Image Text:Question 2: The following information is given for an open economy.
C= 40 + 0.75 (Y-T), I-80, G-50, and T=60
Imports and exports are given by:
IM =0.25Y and X=0.3Y*
Foreign income (Y*) =700
a) Solve for equilibrium output in the domestic economy. (10 points)
b) Solve for the trade balance. Does the country have a trade surplus or deficit? How
much? (5)
c) Draw representative graphs of the goods market and net-exports. Draw your graphs
to illustrate the trade balance at the equilibrium level of output. (10)
d) What happens to equilibrium output and the trade balance if government
expenditures increase to 100? Show the impact of this change on the graphs that
you drew in part c. (10)
e) What is the status of the government budget (deficit/surplus) before and after the
expansionary fiscal policy? (5)
Expert Solution
This question has been solved!
Explore an expertly crafted, step-by-step solution for a thorough understanding of key concepts.
This is a popular solution!
Trending now
This is a popular solution!
Step by step
Solved in 2 steps with 1 images

Knowledge Booster
Learn more about
Need a deep-dive on the concept behind this application? Look no further. Learn more about this topic, economics and related others by exploring similar questions and additional content below.Recommended textbooks for you


Principles of Economics 2e
Economics
ISBN:
9781947172364
Author:
Steven A. Greenlaw; David Shapiro
Publisher:
OpenStax


Principles of Economics 2e
Economics
ISBN:
9781947172364
Author:
Steven A. Greenlaw; David Shapiro
Publisher:
OpenStax