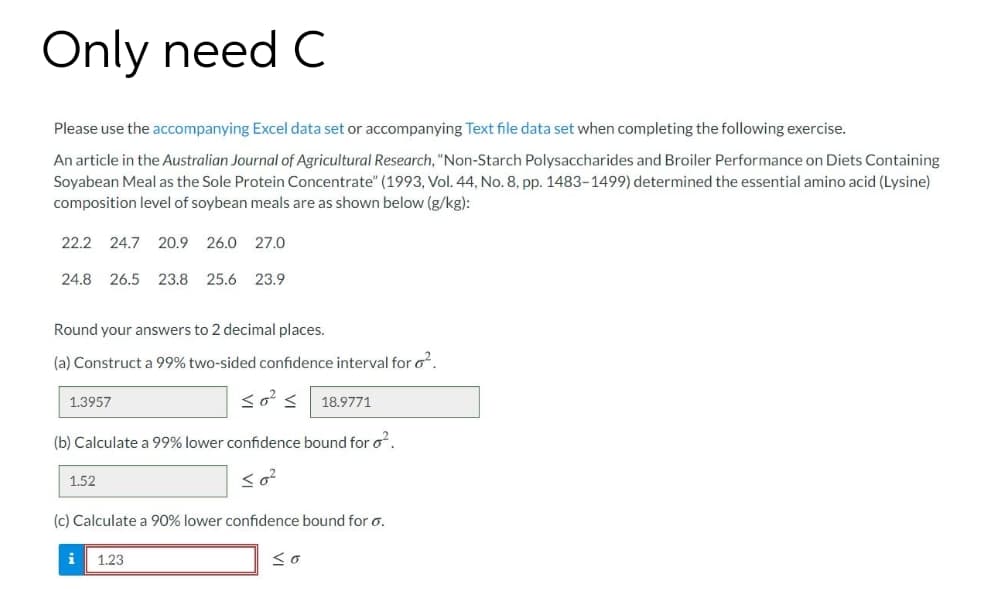
(c) Calculate a 90% lower confidence bound for o. i 1.23


Q: A random sample of male nontraditional students at a Midwestern University yields the following ages...
A: Find the critical value =?
Q: A manufacturer of truck hoods wishes to estimate the mean weight of the hoods being produced from se...
A:
Q: Assume Z has a standard normal distribution. Use Appendix Table III to determine the value for z tha...
A:
Q: Suppose a simple random sample of size n= 50 is obtained from a population whose size is N= 20,000 a...
A: Given,n=50p=0.6
Q: Based on the Normal model for car speeds on an old town highway N(77, 9.1), what is the cutoff value...
A:
Q: In a random sample of five (5) children, the age at which they first began to combine words in speak...
A: Given : Sample size (n) = 5 Sample mean (X¯) = 16.5 Sample S.D (S) = 9.6 Confidence interval =90% S...
Q: ________________ draws from the box, there is more than 50% chance for a red marble to appear at lea...
A: here given box contains 2 red marbles and 98 blue ones so total 100 marbles Here Selection is witho...
Q: A survey of 1000 randomly selected smartphone users found that 86.1% of them used an Android smartph...
A: For the given data Find EBP = ?
Q: If three coins are tossed, what are the mean, variance, and standard deviation of the number of head...
A:
Q: Psychologists have been investigating the differences between people with at least one brother or si...
A: To conclude if the variables 'state of hypertension" and "having siblings" are truly independent, th...
Q: (c) Use a calculator to verify that x = 58, x² = 914, y = 648, r² = 94,842, and xy = 9,073. %3D Comp...
A: Compute r =?
Q: If the mean of a distribution is greater than its median, then a) the distribution has a very high ...
A: If the mean of the distribution is greater than median, then the distribution is skewed. It can be r...
Q: 3. For the t test, one uses instead of o b. s d. z a. n C. t
A:
Q: A regression analysis with formula y 30 + 2x has a standard error of 1, and a t-statistic of 2.0. Th...
A:
Q: An education researcher was interested in examining the effect of the teaching method and the effect...
A: Teachers = 4 Teaching methods = 3 Students are randomly assigned to teacher and teaching method
Q: What is the test statistic for this procedure?
A: Assume that all conditions are met. The mean of the differences was 1.33 and the standard deviation ...
Q: different colours a red ball is drawn. Find the probability that the statement is true. ?
A: Here Given Probability of A speaks truth=P(A)=23 So,Probability of A speaks Lie=P(A')=13 Probabilit...
Q: A political candidate is anxious about the outcome of the next election. To have his next survey res...
A: A political candidate is anxious about the outcome of the next election. To have his next survey res...
Q: In a laboratory experiment, two random samples gave the following Sample results : Size Sample mean ...
A:
Q: The number of visits to a website is known to have a Poisson distribution with a mean of 7 visits pe...
A: Given,The average no.of visits per minute is 7.
Q: Suppose the lengths of human pregnancies are normally distributed with u = 266 days and o= 16 days. ...
A: Given,mean(μ)=266standard deviation(σ)=16
Q: Let X be a binomial random variable withp=D 0.5 and n = 10. Calculate the following probabilities fr...
A:
Q: 6. Let set E = {0,2, 4,6, 8,10} , F = {2,3,5,7,11} : a. Find P(E and F) b. Find P(E or P)
A:
Q: For a standard normal distribution, find: P(z > c) = 0.715 Find c.
A: Given: Z has standard normal distribution Z~N0,1Pz>c=0.715
Q: Steel rods are manufactured with a mean length of 30 centimeter (cm). Because of variability in the ...
A: Given Mean=30 Standard deviations=0.07
Q: Two professors at a local college developed a new teaching curriculum designed to increase students'...
A: Given that : P = 55% Sample size (n) = 15 X = 11 By using hypothesis testing concept ee solve this ...
Q: Two variables have a correlation coefficient of -0.09. The coefficient of determination could be a) ...
A: Given : Correlation coefficient (r) = -0.09
Q: Interviews, whether they be structured or semi/ unstructured, can sometimes be problematics. What fa...
A: Interview is a conversation where one participant asks questions and the other participant responds ...
Q: If 12 = 0-5, r31 = 0-3, r23 0-45, find R3.12. %3D
A: When more than two variables are to establish the degree of relationship then the correlation is sai...
Q: SPAS Statement: Suppose X,,X,..,X, are n independent normal valfates with means u,u,. u, and varianc...
A:
Q: uppose the following regression equation was generated from sample data relating annual salary to ex...
A: Solution: The estimated regression equation is Salary^= 46722.906232+556.281090 Experiance -2443.65...
Q: If covariance between X and Y variables is 10 and the variances of X and Y are respectively 16 and 9...
A:
Q: A random sample of 90 observations produced a sample mean of 25.9 and a sample standard deviation of...
A:
Q: A grocery store is interested in how customers' income affects the amount of money they spend each w...
A: Given : Regression equation : Y^ = 17.80 + 0.0012 x
Q: A study group wants to study if people preferred working from home, working hybrid, or they missed g...
A: We know : Probability = favorable / total
Q: Find the z-score for which the two-tail probability that falls more than z standard deviations from ...
A:
Q: Assume each newborn baby has a probability of approximately 0.49 of being female and 0.51 of being m...
A:
Q: what percent of the scores lie between 247 and 517.
A: The mean SAT verbal score is 427, with a standard 4) deviation of 90. Here use imipirical rule
Q: Please simply write the letter for the test as your answer. Here are the tests: A: one sample z-tes ...
A: The test is to check whether the dinosaur skulls belong to the rare Zotosaurus family or not.
Q: Hotel Number of rooms A Total 307 215 153 675 Hotel A umber of apportioned surfboards pe a whole num...
A: Given A large hotel chain needs to apportion 27 new surfboards for its visitors to rent among three ...
Q: An epidemiologist needs to estimate the proportion of residents of St. Lucie county that have been i...
A:
Q: Steel rods are manufactured with a mean length of 24 centimeter (cm). Because of variability in the ...
A:
Q: What does this following statment mean? In the Korean Sarcopenic Obesity Study, individuals with T2D...
A: Odds refer to the chances of something occurring.
Q: In the binomial probability distribution formula, what does the variable q represent? Select one: O ...
A:
Q: Question 9. The less overlap there is among sample distributions, the: more confident we are that th...
A: Given problem Given that The less overlap there is among sample distributions, the
Q: Question 1 You and your 4 other friends play 5 ranked games in Mobile Legends every day for the past...
A:
Q: 8. Hand in United Bank has 450 branches. Management is interested in the average number of business ...
A: Given: Mean = 60 Variance = 20
Q: A small country with a population of 8,000,000 consists of four states, A, B, C, and D. There are 15...
A:
Q: Which of the following equations is the formula used to estimate the numerical characteristics of th...
A:
Q: An analysis of variances produces dftotal = 16 and dfwithin = 14. For this analysis, how many treatm...
A:


Trending now
This is a popular solution!

Step by step
Solved in 4 steps with 3 images

- Urban Travel Times Population of cities and driving times are related, as shown in the accompanying table, which shows the 1960 population N, in thousands, for several cities, together with the average time T, in minutes, sent by residents driving to work. City Population N Driving time T Los Angeles 6489 16.8 Pittsburgh 1804 12.6 Washington 1808 14.3 Hutchinson 38 6.1 Nashville 347 10.8 Tallahassee 48 7.3 An analysis of these data, along with data from 17 other cities in the United States and Canada, led to a power model of average driving time as a function of population. a Construct a power model of driving time in minutes as a function of population measured in thousands b Is average driving time in Pittsburgh more or less than would be expected from its population? c If you wish to move to a smaller city to reduce your average driving time to work by 25, how much smaller should the city be?Here is a dataset containing plant growth measurements of plants grown in solutions of commonly-found chemicals in roadway runoff.Phragmites australis, a fast-growing non-native grass common to roadsides and disturbed wetlands of Tidewater Virginia, was grown in a greenhouse and watered with either: Distilled water (control); A weak petroleum solution (representing standard roadway runoff); Sodium chloride solution; Magnesium chloride solution; De-icing brine (50% sodium chloride and 50% magnesium chloride).Twenty grass preparations were used for each solution, and total growth (in cm) was recorded after watering every other day for 40 days.-Perform the correct statistical test to determine the p-value.-Report your answer rounded to four decimal places.-You should use formulas, functions, and the Data Analysis ToolPak in MS Excel to avoid additive rounding errors. Here are some useful functions: =t.test(array1,array2,tails,type) Produces a p-value for any…The spike stature of the plants grown from the seeds of the porcine separates (Dactylis glomerata L) collected from the University campus and İbradı Eynif pasture are given below. In this plant, compare whether there is a difference between regions in terms of spike height. Virgo Height (cm) Data obtained from plants collected from university campus 5 6 8 7 8 6 5 5 4 6 6 Data obtained from plants collected from Eynif pasture 12 9 11 9 9 11 9 10 11 10 Note: Your results interpretation according to two different possibilities (Do it separately, assuming that it is 0.07 and 0.04).
- A deficiency of the trace element selenium in the diet can negatively impact growth, immunity, muscle and neuromuscular function, and fertility. The introduction of selenium supplements to dairy cows is justified when pastures have low selenium levels. Authors of a research paper supplied the following data on milk selenium concentration (mg/L) for a sample of cows given a selenium supplement (the treatment group) and a control sample given no supplement, both initially and after a 9-day period. Initial Measurement Treatment Control 11.2 9.1 9.6 8.7 10.1 9.7 8.5 10.8 10.3 10.9 10.6 10.6 11.7 10.1 9.7 12.3 10.8 8.8 10.3 10.4 10.4 10.9 11.2 10.4 9.4 11.6 10.6 10.9 10.7 8.4 After 9 Days Treatment Control 138.3 9.3 104 8.7 96.4 8.7 89 10.1 88 9.6 103.8 8.6 147.3 10.2 97.1 12.2 172.6 9.3 146.3 9.5 99 8.2 122.3 8.9 103 12.5 117.8 9.1 121.5 93 (a) Use the given data for the treatment group to determine if there…A deficiency of the trace element selenium in the diet can negatively impact growth, immunity, muscle and neuromuscular function, and fertility. The introduction of selenium supplements to dairy cows is justified when pastures have low selenium levels. Authors of a research paper supplied the following data on milk selenium concentration (mg/L) for a sample of cows given a selenium supplement (the treatment group) and a control sample given no supplement, both initially and after a 9-day period. Initial Measurement Treatment Control 11.3 9.1 9.7 8.7 10.1 9.7 8.5 10.8 10.4 10.9 10.7 10.6 11.8 10.1 9.8 12.3 10.6 8.8 10.4 10.4 10.2 10.9 11.3 10.4 9.2 11.6 10.7 10.9 10.8 8.2 After 9 Days Treatment Control 138.3 9.4 104 8.8 96.4 8.8 89 10.1 88 9.7 103.8 8.7 147.3 10.3 97.1 12.3 172.6 9.4 146.3 9.5 99 8.3 122.3 8.9 103 12.5 117.8 9.1 121.5 93 (a) Use the given data for the treatment group to determine if…A deficiency of the trace element selenium in the diet can negatively impact growth, immunity, muscle and neuromuscular function, and fertility. The introduction of selenium supplements to dairy cows is justified when pastures have low selenium levels. Authors of a research paper supplied the following data on milk selenium concentration (mg/L) for a sample of cows given a selenium supplement (the treatment group) and a control sample given no supplement, both initially and after a 9-day period. Initial Measurement Treatment Control 11.4 9.1 9.6 8.7 10.1 9.7 8.5 10.8 10.2 10.9 10.6 10.6 11.9 10.1 9.9 12.3 10.7 8.8 10.2 10.4 10.3 10.9 11.4 10.4 9.3 11.6 10.6 10.9 10.9 8.3 After 9 Days Treatment Control 138.3 9.2 104 8.9 96.4 8.9 89 10.1 88 9.6 103.8 8.6 147.3 10.4 97.1 12.4 172.6 9.2 146.3 9.5 99 8.4 122.3 8.8 103 12.5 117.8 9.1 121.5 93 (a) Use the given data for the treatment group to determine if…
- A paper investigated the driving behavior of teenagers by observing their vehicles as they left a high school parking lot and then again at a site approximately 1 2 mile from the school. Assume that it is reasonable to regard the teen drivers in this study as representative of the population of teen drivers. Amount by Which Speed Limit Was Exceeded MaleDriver FemaleDriver 1.2 -0.1 1.4 0.4 0.9 1.1 2.1 0.7 0.7 1.1 1.3 1.2 3 0.1 1.3 0.9 0.6 0.5 2.1 0.5 (a) Use a .01 level of significance for any hypothesis tests. Data consistent with summary quantities appearing in the paper are given in the table. The measurements represent the difference between the observed vehicle speed and the posted speed limit (in miles per hour) for a sample of male teenage drivers and a sample of female teenage drivers. (Use μmales − μfemales.Round your test statistic to two decimal places. Round your degrees of freedom down to the nearest whole number. Round your p-value to…A paper investigated the driving behavior of teenagers by observing their vehicles as they left a high school parking lot and then again at a site approximately 1 2 mile from the school. Assume that it is reasonable to regard the teen drivers in this study as representative of the population of teen drivers. Amount by Which Speed Limit Was Exceeded MaleDriver FemaleDriver 1.3 -0.1 1.3 0.4 0.9 1.1 2.1 0.7 0.7 1.1 1.3 1.2 3 0.1 1.3 0.9 0.6 0.5 2.1 0.5 (a) Use a .01 level of significance for any hypothesis tests. Data consistent with summary quantities appearing in the paper are given in the table. The measurements represent the difference between the observed vehicle speed and the posted speed limit (in miles per hour) for a sample of male teenage drivers and a sample of female teenage drivers. (Use μmales − μfemales.Round your test statistic to two decimal places. Round your degrees of freedom down to the nearest whole number. Round your p-value to…The table below shows the numbers of bushels of barley cultivated per acre for 12 one-acre plots of land for two different strains of barley, PHT-34 and CBX-21. PHT-34 CBX-21 43 55 49 46 47 43 38 44 47 45 45 49 50 47 46 59 46 52 46 49 45 48 43 51 Determine the minimum data value, the quartiles, and the maximum data value for the PHT-34 and CBX-21 data sets. PHT-34 CBX-21 min Q1 Q2 Q3 max
- rofessor Cornish studied rainfall cycles and sunspot cycles. (Reference: Australian Journal of Physics, Vol. 7, pp. 334-346.) Part of the data include amount of rain (in mm) for 6-day intervals. The following data give rain amounts for consecutive 6-day intervals at Adelaide, South Australia. 7 28 7 1 69 3 1 4 22 7 16 4 54 160 60 73 27 3 3 1 7 144 107 4 91 44 1 8 4 22 4 59 116 52 4 155 42 24 11 43 3 24 19 74 26 63 110 39 34 71 52 39 8 0 15 2 14 9 1 2 4 9 6 10 (i) Find the median. (Use 1 decimal place.)(ii) Convert this sequence of numbers to a sequence of symbols A and B, where A indicates a value above the median and B a value below the median. Test the sequence for randomness about the median at the 5% level of significance. (b) Find the number of runs R, n1, and n2. Let n1 = number of values above the median and n2 = number of values below the median. R n1 n2 (c) In the case, n1 > 20, we cannot use Table 10 of Appendix II to find the critical…Lactation promotes a temporary loss of bone mass to provide adequate amounts of calcium for milk production. The paper “Bone Mass Is Recovered from Lactation to Postweaning in Adolescent Mothers with Low Calcium Intakes” (Amer. J. of Clinical Nutr., 2004: 1322–1326) gave the following data on total body bone mineral content (TBBMC) (g) for a sample both during lactation (L) and in the postweaning period (P). SubjectL 1928 2549 2825 1924 1628 2175 2114 2621 1843 2541P 2126 2885 2895 1942 1750 2184 2164 2626 2006 2627 Does the data suggest that true average total body bone mineral content during postweaning exceeds that during lactation by more than 25 g? State and test the appropriate hypotheses using a significance level of .05.Following are measurements of soil concentrations (in mg /kg) of chromium (Cr) and nickel (Ni) at20 sites in the area of Cleveland, Ohio. These data are taken from the article "Variation in NorthAmerican Regulatory Guidance for Heavy Metal Surface Soil Contamination at Commercial andIndustrial Sites" (A. Jennings and J. Ma, J. Environment Eng, 2007:587-609). Cr: 260 19 36 247 263 319 317 277 319 264 23 29 61 119 33 281 21 35 64 30Ni: 435 377 359 53 38 38 54 188 397 33 92 490 28 35 799 347 321 32 74 508 (a) Construct a histogram for each set of concentrations. (b) Find the 1st, 2nd and 3rd quartiles for the Cr concentrations (c) Find the 1st, 2nd and 3rd quartiles for the Ni concentrations.


