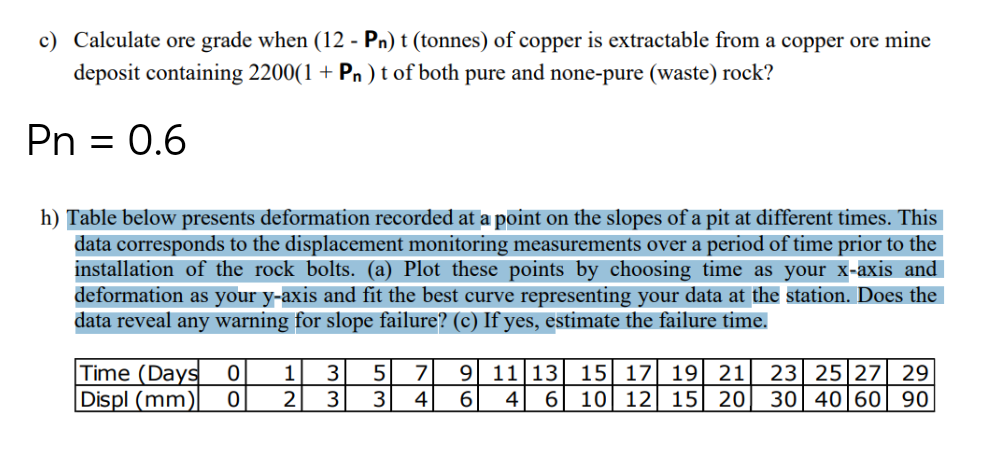
c) Calculate ore grade when (12 - Pn) t (tonnes) of copper is extractable from a copper ore mine deposit containing 2200(1 + Pn) t of both pure and none-pure (waste) rock? Pn = 0.6 h) Table below presents deformation recorded at a point on the slopes of a pit at different times. This data corresponds to the displacement monitoring measurements over a period of time prior to the installation of the rock bolts. (a) Plot these points by choosing time as your x-axis and deformation as your y-axis and fit the best curve representing your data at the station. Does the data reveal any warning for slope failure? (c) If yes, estimate the failure time. Time (Days 0 1 3 Displ (mm) 0 2 3 5 7 4 53 3 9 11 13 6 4 6 15 17 19 21 23 25 27 29 10 12 15 20 30 40 60 90
c) Calculate ore grade when (12 - Pn) t (tonnes) of copper is extractable from a copper ore mine deposit containing 2200(1 + Pn) t of both pure and none-pure (waste) rock? Pn = 0.6 h) Table below presents deformation recorded at a point on the slopes of a pit at different times. This data corresponds to the displacement monitoring measurements over a period of time prior to the installation of the rock bolts. (a) Plot these points by choosing time as your x-axis and deformation as your y-axis and fit the best curve representing your data at the station. Does the data reveal any warning for slope failure? (c) If yes, estimate the failure time. Time (Days 0 1 3 Displ (mm) 0 2 3 5 7 4 53 3 9 11 13 6 4 6 15 17 19 21 23 25 27 29 10 12 15 20 30 40 60 90
Elements Of Electromagnetics
7th Edition
ISBN:9780190698614
Author:Sadiku, Matthew N. O.
Publisher:Sadiku, Matthew N. O.
ChapterMA: Math Assessment
Section: Chapter Questions
Problem 1.1MA
Related questions
Question

Transcribed Image Text:c) Calculate ore grade when (12 - Pn) t (tonnes) of copper is extractable from a copper ore mine
deposit containing 2200(1 + Pn ) t of both pure and none-pure (waste) rock?
Pn = 0.6
h) Table below presents deformation recorded at a point on the slopes of a pit at different times. This
data corresponds to the displacement monitoring measurements over a period of time prior to the
installation of the rock bolts. (a) Plot these points by choosing time as your x-axis and
deformation as your y-axis and fit the best curve representing your data at the station. Does the
data reveal any warning for slope failure? (c) If yes, estimate the failure time.
Time (Days 0 1 3
Displ (mm) 0 2 3
5
3
7
4
9 11 13 15 17 19 21 23 25 27 29
6 4 6 10 12 15 20 30 40 60 90
Expert Solution
This question has been solved!
Explore an expertly crafted, step-by-step solution for a thorough understanding of key concepts.
Step by step
Solved in 3 steps with 2 images

Knowledge Booster
Learn more about
Need a deep-dive on the concept behind this application? Look no further. Learn more about this topic, mechanical-engineering and related others by exploring similar questions and additional content below.Recommended textbooks for you

Elements Of Electromagnetics
Mechanical Engineering
ISBN:
9780190698614
Author:
Sadiku, Matthew N. O.
Publisher:
Oxford University Press

Mechanics of Materials (10th Edition)
Mechanical Engineering
ISBN:
9780134319650
Author:
Russell C. Hibbeler
Publisher:
PEARSON

Thermodynamics: An Engineering Approach
Mechanical Engineering
ISBN:
9781259822674
Author:
Yunus A. Cengel Dr., Michael A. Boles
Publisher:
McGraw-Hill Education

Elements Of Electromagnetics
Mechanical Engineering
ISBN:
9780190698614
Author:
Sadiku, Matthew N. O.
Publisher:
Oxford University Press

Mechanics of Materials (10th Edition)
Mechanical Engineering
ISBN:
9780134319650
Author:
Russell C. Hibbeler
Publisher:
PEARSON

Thermodynamics: An Engineering Approach
Mechanical Engineering
ISBN:
9781259822674
Author:
Yunus A. Cengel Dr., Michael A. Boles
Publisher:
McGraw-Hill Education

Control Systems Engineering
Mechanical Engineering
ISBN:
9781118170519
Author:
Norman S. Nise
Publisher:
WILEY

Mechanics of Materials (MindTap Course List)
Mechanical Engineering
ISBN:
9781337093347
Author:
Barry J. Goodno, James M. Gere
Publisher:
Cengage Learning

Engineering Mechanics: Statics
Mechanical Engineering
ISBN:
9781118807330
Author:
James L. Meriam, L. G. Kraige, J. N. Bolton
Publisher:
WILEY