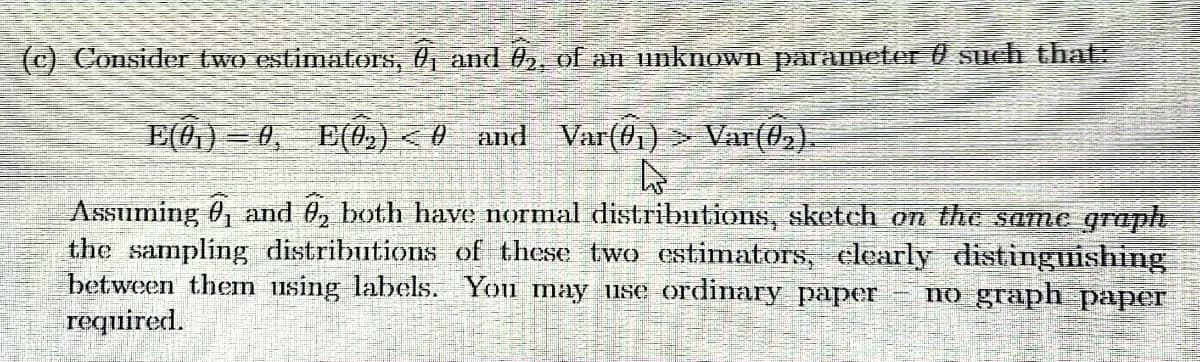
(c) Consider two estimators, 01 and 92, of an unknown parameter such that: E(0₁) = 0, E(0₂) < 0 and Var(0₁) Var(0₂). 4 Assuming ₁ and 2 both have normal distributions, sketch on the same graph the sampling distributions of these two estimators, clearly distinguishing between them using labels. You may use ordinary paper no graph paper required.
Q: SOLVE THE FOLLOWING PROBLEM FOR CENTRAL TENDENCY AND MATH SCORES F X FX <CF 59 - 74 111 75 - 90 143…
A: “Since you have asked multiple question, we will solve the first question for you. If you want any…
Q: 160 140 120 100 80 60 40 20 0 41-50 Disney Animated Films Runtime (minutes) 51-60 61-70 71-80 81-90…
A: The types of charts are line graph, dotted chart, polygon chart etc.. The scale of measurements are…
Q: Random variables X and Y have density functions 1 fx(x) =-[u(x)−u(x-a)] and fy(y) = bu(y)e-by where…
A:
Q: A matched-pair case-control study was conducted in order to assess if there is a relationship…
A: Given: A matched-pair case-control study was conducted to assess the relation between serum vitamin…
Q: 8 Let X have the negative binomial distribution f(x) = (+=¦)p²(1-p)¹ for x=r,r+1,... (a) Obtain the…
A:
Q: A sample of 800 computer chips revealed that 43% of the chips do not fail in the first 1000 hours of…
A: Use the One sample Z-proportional test The following information is provided: The sample size is n…
Q: In a recent study, a scientist was interested in investigating whether there is a significant…
A: Solution
Q: Use the results from a survey of a simple random sample of 1048 adults. Among the 1048 respondents,…
A: From the given information, The random sample size is, n = 1048 a) Given that 89% of the sample of…
Q: The height of bean plants and the amount of water they receive A. Independent B. Dependent
A: The variable whose value not affected by any other variable is known as independent variable. The…
Q: INSTRUCTION: Complete the table below by applying hypothesis testing in problem-solving. 1. A…
A:
Q: Find the area and normal curve Between z = 0 and z = 1.34
A:
Q: Determine if the random variables are statistically independent.
A: f(x)=∫yf(x,y) dy =∫y=02(x2+xy3) dy =x2∫02dy +x3∫02y dy =x2 y02…
Q: Hi can u help with question E please?
A:
Q: 3. Problem 6. Yna likes to play cards. She draws 14 cards from a pack of 52 cards. What is the…
A: 3. The random experiments is follows hypergeometric distribution N=52 cards k=36 cards n=14 x=4…
Q: oportion. There's a different formula for the margin of error for sample proportio p(1-p) DE = 2*. n…
A: Given N=240 P cap=0.20
Q: A matched-pair case-control study was conducted in order to assess if there is a relationship…
A:
Q: 2. The article presents an assessment of the health outcomes of people working in an environment…
A: The question is about categorical data analysis using chi square test Given :
Q: From a sample with n=24, the mean number of televisions per household is 4 with a standard…
A:
Q: Find k, P(-k< Z < k) = 0.8664, Z~ N(μ = 0,0² = 1).
A: Required probability is P(-k<Z<k)=0.8664
Q: A local charity holds a carnival to raise money. In one activity, participants make a $3 donation…
A:
Q: Find the area and normal curve Greater than z = -0.78
A:
Q: ndard deviation of 1 television. Using Chebychev's Theorem, determine at least how many of the…
A:
Q: the Using the frequency Istri presen Apply. given facts for the identified quartile, decile and…
A: Given data is General Average Frequency(f) Lower Boundaries (LB) <cf 95-99 2 94.5 35…
Q: The U.S. Energy Information Administration claimed that U.S. residential customers used an average…
A: Given X-bar=11156 Mean=10817 Standard deviations=1913 n=174
Q: t be the case that P(An B) = 0.5? Why or why not? [Hint: For any two sets A and B if A is a subset…
A: Given P(A)=0.6 P(B)=0.3
Q: Problem 1. Find the value of k for which the following function would be a valid probability density…
A: Solution
Q: The joint pdf of a bivariate random variable (X,Y) is given by [Kx²y, x₁ = 1,2; y, = 1,2,3 Px,y (x₁,…
A:
Q: Twenty five right-handed students were asked to turn a knob (using their right hands) that move…
A: Obs R L difference(d) 1 113 137 -24 2 105 105 0 3 130 133 -3 4 101 108 -7 5 138 115 23…
Q: State the null and alternative hypotheses of the following statements (in words). 1. The claim is…
A: According to our policy we can answer only first question, kindly repost other question.
Q: The table shows population statistics for the ages of Best Actor and Best Supporting Actor winners…
A: The mean and standard deviation of best actor are 42 and 8.5, respectively.
Q: The mean annual household income in Region I is 258,000. In a sample of 40 families taken at various…
A: Given: Sample size, n=40 Sample mean,x¯=230000sample sd,s=6851
Q: A magazine claims that the mean amount spent by a customer at Burger Stop is greater than the mean…
A: GivenFor Burger stopx1=5.46s1=0.89n1=22For Fry Worldx2=5.12s2=0.79n2=30α=0.05
Q: Observed numbers of metals in various categories with regard to a diameter specification Too Machine…
A:
Q: Verify that the following function is a probability mass function, and determine the requested…
A:
Q: A machine is used to fill soda bottles. The amount of soda dispensed into each bottle varies…
A: The amount of soda distributed into bottles is normally distributed. The objective is to find the…
Q: Given the joint pdf of X and Y is fxy(x, y) Find P(X>Y). = -{abe abe-(ax+by) x>0, y>0 otherwise
A:
Q: please sove D) and e)
A: Variables are of two types, they are independent and dependent. Two events are said to be…
Q: 44. Find H.M. from the following data. 44 46 48 50 Weights No. of persons 8 10 4 6 52 54 12 10
A:
Q: A matched-pair case-control study was conducted in order to assess if there is a relationship…
A: Given: A matched-pair case-control study was conducted to assess the relationship between serum…
Q: a. Find the probability that a single randomly selected first-time vehicle purchase is less than…
A:
Q: The appropriate form of the test-statistics in conducting hypothesis testing about the population…
A: Assume that p as the true proportion and n is the sample size.
Q: The following data is best described using the growth model y = linear regression to determine the…
A: Given: Sample size n = 6 Formula Used: The equation of simple linear regression is: Y = a + bX Where…
Q: A small generator burns two types of fuel low sulfur and high sulfur to produce electricity. For one…
A:
Q: craft not discovered do not have such a locator. Suppose a light aircraft has disappeared. (Round…
A: Given Seventy-eight percent of the light aircraft that disappear while in flight in a certain…
Q: b) Find the variance Var(X) of X.
A:
Q: The midterm grades of randomly picked eight students in an MMW class are as follows: 84, 90, 74, 84,…
A:
Q: A company wants to evaluate its attrition rate. In other words, how long new hires stay with the…
A: Let X = the number of years a new hire will stay with the company Let P(x) = the probability that a…
Q: 11. Find the 30th percentile of the total examinees. B. 9,830 A. 9,645 12. Find P80 of the days…
A: 11) The objective is to find 30th percentile of the total examinees. Arrange the data in ascending…
Q: Actuarial Statistics The severity claims in a year to a insurance provider follow a 3 parameter Burr…
A:
Q: e. Find the conditional density f(xly). f. Find the conditional density f(ylx). g. Find P(Y> 1 | X=…
A: Given that We have to find a..f(x/y) b..f(y/x) c..P(Y>1/X=1/2)
Step by step
Solved in 2 steps with 1 images
- A random sample of n1=17�1=17 securities in Economy A produced mean returns of x̄ 1=5.6% x̄ 1=5.6% with s1=2.3%�1=2.3% while another random sample of n2=20�2=20 securities in Economy B produced mean returns of x̄ 2=4.6% x̄ 2=4.6% with s2=2.3%.�2=2.3%. At α =0.2 α =0.2, can we infer that the returns differ significantly between the two economies? Assume that the samples are independent and randomly selected from normal populations with equal population variances ( σ 12= σ 22)( σ 12= σ 22). T-Distribution Table a. Calculate the test statistic. t=�= Round to three decimal places if necessary b. Determine the critical value(s) for the hypothesis test. + Round to three decimal places if necessary c. Conclude whether to reject the null hypothesis or not based on the test statistic. Reject Fail to Reject9.1) Suppose X1, X2, and X3, denotes a random sample from the exponential distribution with density function shown in the image. a) Which of the above estimators are unbiased for θ? b) Among the unbiased estimators of θ, which has the smallest variance?1. Suppose X1,X2,...,Xn is a random sample of size n > 5 that comes from a distribution with E[X] = μand V ar(X) = σ2. Consider the following two estimators where ̄X is the sample mean:ˆμ1 = (n −3/n) ̄Xˆμ2 = 0.95 ̄X(a) Which of the estimators is an unbiased estimator for μ?(b) Which is the variance of the two estimators?(c) Given the properties above, which one would you prefer? Is there another property that wouldinfluence your decision? Explain.
- a hypothesis test produces a t statistic of t=2.3. if the researcher is using a two tailed test with a=0.05 how large does the sample have to bw in order to reject the null hypothesis?A random sample of n1 = 14 winter days in Denver gave a sample mean pollution index x1 = 43. Previous studies show that σ1 = 19. For Englewood (a suburb of Denver), a random sample of n2 = 12 winter days gave a sample mean pollution index of x2 = 37. Previous studies show that σ2 = 13. Assume the pollution index is normally distributed in both Englewood and Denver. (a) State the null and alternate hypotheses. H0: μ1 = μ2; H1: μ1 > μ2 H0: μ1 < μ2; H1: μ1 = μ2 H0: μ1 = μ2; H1: μ1 < μ2 H0: μ1 = μ2; H1: μ1 ≠ μ2 (b) What sampling distribution will you use? What assumptions are you making? The Student's t. We assume that both population distributions are approximately normal with known standard deviations. The standard normal. We assume that both population distributions are approximately normal with unknown standard deviations. The standard normal. We assume that both population distributions are approximately normal with known standard deviations. The Student's t. We…If X1 and X2 constitute a random sample of size n = 2from an exponential population, find the efficiency of 2Y1relative to X, where Y1 is the first order statistic and 2Y1and X are both unbiased estimators of the parameter
- 1) For a two-tailed hypothesis using a z-distribution, find the critical values (z-scores)that will give you a critical region with an alpha of the following values: a) alpha = 0.20 b) alpha = 0.10 c) alpha = 0.05 d) alpha = 0.01 e) alpha = 0.001Mr. Lange draws two independent random samples from normally-distributed popula- tions with unknown population means and unknown population vari- ances. The first sample is found to have x = 78, s21 = 25, and n = 10; while the second sample is found to have y = 74, s2 = 9, and n = 16. Mr. Lange wishes to use Welch’s T Test to determine whether there is enough evidence to conclude the population means differ. Answer the following questions. (a) State the competing theories of this test. (b) Are the requirements for Welch’s T Test met? If not, explain why. (c) Compute the T statistic for Welch’s T Test. Round your answer to three decimal places. (d) What distribution does the T statistic have? (e) Compute α0 as discussed in class. What conclusion can you draw?