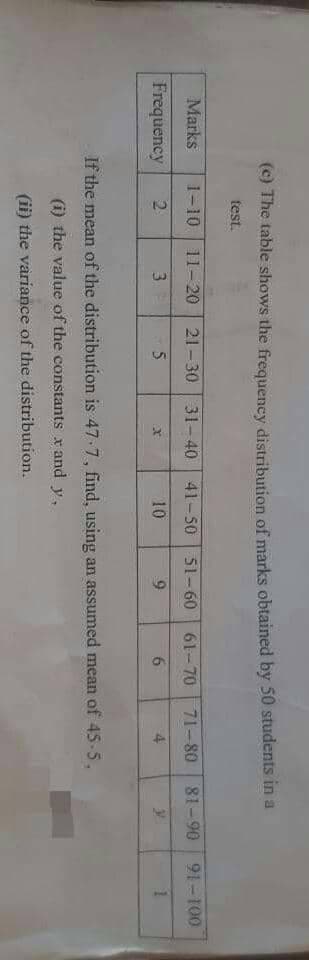
(c) The table shows the frequency distribution of marks obtained by 50 students in a test. Marks 1-10 11-20 21-30 31-40 41-50 51-60 61-70 71-80 81-90 91-100 Frequency 2 3 5 x 10 9 6 4 y 1 If the mean of the distribution is 47-7, find, using an assumed mean of 45-5. (i) the value of the constants x and y, (ii) the variance of the distribution.
(c) The table shows the frequency distribution of marks obtained by 50 students in a test. Marks 1-10 11-20 21-30 31-40 41-50 51-60 61-70 71-80 81-90 91-100 Frequency 2 3 5 x 10 9 6 4 y 1 If the mean of the distribution is 47-7, find, using an assumed mean of 45-5. (i) the value of the constants x and y, (ii) the variance of the distribution.

Glencoe Algebra 1, Student Edition, 9780079039897, 0079039898, 2018
18th Edition
ISBN:9780079039897
Author:Carter
Publisher:Carter
Chapter10: Statistics
Section10.2: Representing Data
Problem 24PFA

Related questions
Question
Transcribed Image Text:(c) The table shows the frequency distribution of marks obtained by 50 students in a
test.
Marks 1-10 11-20 21-30 31-40 41-50 51-60 61-70 71-80 81-90 91-100
Frequency 2
3
5
10
x
9
6
4
1
y
If the mean of the distribution is 47-7, find, using an assumed mean of 45-5.
(i) the value of the constants x and y,
(ii) the variance of the distribution.
Expert Solution
This question has been solved!
Explore an expertly crafted, step-by-step solution for a thorough understanding of key concepts.

This is a popular solution!

Trending now
This is a popular solution!

Step by step
Solved in 4 steps with 4 images

Recommended textbooks for you
Glencoe Algebra 1, Student Edition, 9780079039897…
Algebra
ISBN:
9780079039897
Author:
Carter
Publisher:
McGraw Hill
Glencoe Algebra 1, Student Edition, 9780079039897…
Algebra
ISBN:
9780079039897
Author:
Carter
Publisher:
McGraw Hill