(c) What is the point estimate (in dollars) of the difference between the population means? $ 840 What is the 98% confidence interval estimate (in dollars) of the difference between the population means? (Round your answers to the nearest cent.) $ 489 X to $ 1191 Interpret this interval.
(c) What is the point estimate (in dollars) of the difference between the population means? $ 840 What is the 98% confidence interval estimate (in dollars) of the difference between the population means? (Round your answers to the nearest cent.) $ 489 X to $ 1191 Interpret this interval.

Glencoe Algebra 1, Student Edition, 9780079039897, 0079039898, 2018
18th Edition
ISBN:9780079039897
Author:Carter
Publisher:Carter
Chapter4: Equations Of Linear Functions
Section: Chapter Questions
Problem 8SGR

Related questions
Question
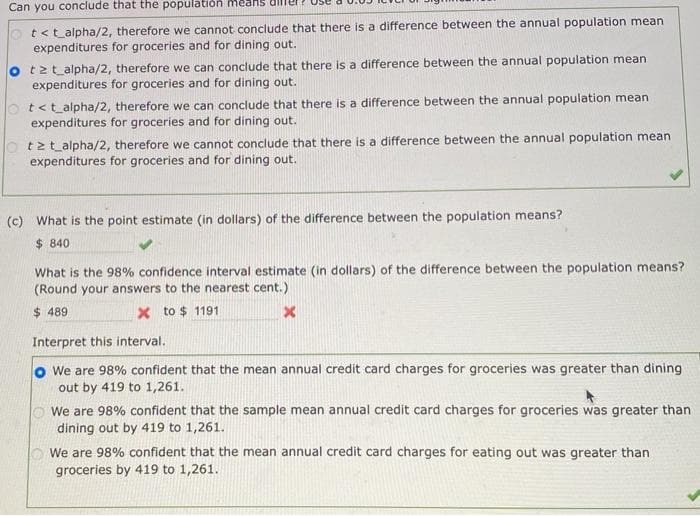
Transcribed Image Text:Can you conclude that the populatión Means
t<t_alpha/2, therefore we cannot conclude that there is a difference between the annual population mean
expenditures for groceries and for dining out.
o tzt_alpha/2, therefore we can conclude that there is a difference between the annual population mean
expenditures for groceries and for dining out.
t<t_alpha/2, therefore we can conclude that there is a difference between the annual population mean
expenditures for groceries and for dining out.
tzt_alpha/2, therefore we cannot conclude that there is a difference between the annual population mean
expenditures for groceries and for dining out.
(c) What is the point estimate (in dollars) of the difference between the population means?
$ 840
What is the 98% confidence interval estimate (in dollars) of the difference between the population means?
(Round your answers to the nearest cent.)
$ 489
X to $ 1191
Interpret this interval.
o We are 98% confident that the mean annual credit card charges for groceries was greater than dining
out by 419 to 1,261.
We are 98% confident that the sample mean annual credit card charges for groceries was greater than
dining out by 419 to 1,261.
We are 98% confident that the mean annual credit card charges for eating out was greater than
groceries by 419 to 1,261.
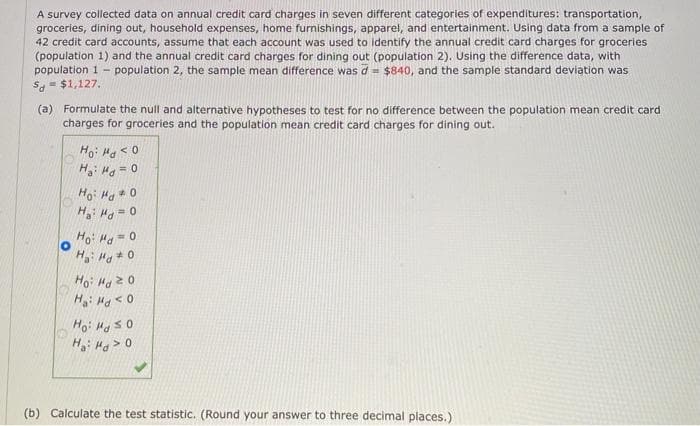
Transcribed Image Text:A survey collected data on annual credit card charges in seven different categories of expenditures: transportation,
groceries, dining out, household expenses, home furnishings, apparel, and entertainment. Using data from a sample of
42 credit card accounts, assume that each account was used to identify the annual credit card charges for groceries
(population 1) and the annual credit card charges for dining out (population 2). Using the difference data, with
population 1 - population 2, the sample mean difference was d= $840, and the sample standard deviation was
S- $1,127.
(a) Formulate the null and alternative hypotheses to test for no difference between the population mean credit card
charges for groceries and the population mean credit card charges for dining out.
H: Hg = 0
Ho: H # 0
H H= 0
Ho: Ha= 0
Ho: Ha 2 0
H: Ha < 0
H Ha > 0
(b) Calculate the test statistic. (Round your answer to three decimal places.)
Expert Solution
This question has been solved!
Explore an expertly crafted, step-by-step solution for a thorough understanding of key concepts.

Step by step
Solved in 2 steps with 2 images

Recommended textbooks for you
Glencoe Algebra 1, Student Edition, 9780079039897…
Algebra
ISBN:
9780079039897
Author:
Carter
Publisher:
McGraw Hill
Glencoe Algebra 1, Student Edition, 9780079039897…
Algebra
ISBN:
9780079039897
Author:
Carter
Publisher:
McGraw Hill