c. Table: I created a table of values and used the table to identify the solution. d. Graph: I created a graph and used the graph to identify the solution.
c. Table: I created a table of values and used the table to identify the solution. d. Graph: I created a graph and used the graph to identify the solution.

Practical Management Science
6th Edition
ISBN:9781337406659
Author:WINSTON, Wayne L.
Publisher:WINSTON, Wayne L.
Chapter2: Introduction To Spreadsheet Modeling
Section: Chapter Questions
Problem 46P

Related questions
Question
I need help with QUESTION 7. How would I make a table and graph for the solutions for problems 3-5
Transcribed Image Text:TEAM
Arkansas
LSU
Florida
Kentucky
Tennessee
South Carolina
ATT.
224
311
296
368
345
323
337
360
Vanderbilt
Alabama
Auburn
Georgia
TD PASSES
19
26
23
27
23
TDS/
ATTEMPT
11.8
12.0
12.9
13.6
15.0
16.2
21.1
21.2
21.4
31.7
32.1
36.2
20
16
17
257
12
285
9
Ole Miss
257
8
Mississippi State
326
9
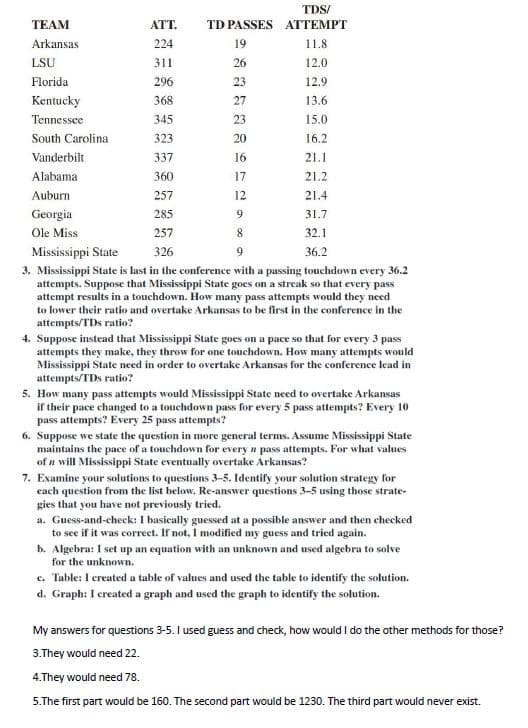
3. Mississippi State is last in the conference with a passing touchdown every 36.2
attempts. Suppose that Mississippi State goes on a streak so that every pass
attempt results in a touchdown. How many pass attempts would they need
to lower their ratio and overtake Arkansas to be first in the conference in the
attempts/TDs ratio?
4. Suppose instead that Mississippi State goes on a pace so that for every 3 pass
attempts they make, they throw for one touchdown. How many attempts would
Mississippi State need in order to overtake Arkansas for the conference lead in
attempts/TDs ratio?
5. How many pass attempts would Mississippi State need to overtake Arkansas
if their pace changed to a touchdown pass for every 5 pass attempts? Every 10
pass attempts? Every 25 pass attempts?
6. Suppose we state the question in more general terms. Assume Mississippi State
maintains the pace of a touchdown for every n pass attempts. For what values
of n will Mississippi State eventually overtake Arkansas?
7. Examine your solutions to questions 3-5. Identify your solution strategy for
each question from the list below. Re-answer questions 3-5 using those strate-
gies that you have not previously tried.
a. Guess-and-check: I basically guessed at a possible answer and then checked
to see if it was correct. If not, I modified my guess and tried again.
b. Algebra: I set up an equation with an unknown and used algebra to solve
for the unknown.
c. Table: I created a table of values and used the table to identify the solution.
d. Graph: I created a graph and used the graph to identify the solution.
My answers for questions 3-5. I used guess and check, how would I do the other methods for those?
3.They would need 22.
4.They would need 78.
5.The first part would be 160. The second part would be 1230. The third part would never exist.
Expert Solution
This question has been solved!
Explore an expertly crafted, step-by-step solution for a thorough understanding of key concepts.

Step by step
Solved in 6 steps with 2 images

Recommended textbooks for you
Practical Management Science
Operations Management
ISBN:
9781337406659
Author:
WINSTON, Wayne L.
Publisher:
Cengage,
Practical Management Science
Operations Management
ISBN:
9781337406659
Author:
WINSTON, Wayne L.
Publisher:
Cengage,