Calcium is essential to tree growth because it promotes the formation of wood and maintains cell walls. In 1990, the concentration of calcium in precipitation in a certain area was 0.12 milligrams per liter (mg/L). A random sample of 10 precipitation dates in 2007 results in the following data table. Complete parts (a) through (c) below. Click the icon to view the data table. Data table (a) State the hypotheses for determining if the mean concentration of calcium precipitation has changed since 1990. Ho: H 0.12 mg/L H₂: H # 0.12 mg/L 0.074 0.075 0.071 0.257 0.116 0.177 0.107 0.247 0.333 0.102 (b) Construct a 90% confidence interval about the sample mean concentration of calcium precipitation. The lower bound is The upper bound is. Print (Round to four decimal places as needed.) Done
Calcium is essential to tree growth because it promotes the formation of wood and maintains cell walls. In 1990, the concentration of calcium in precipitation in a certain area was 0.12 milligrams per liter (mg/L). A random sample of 10 precipitation dates in 2007 results in the following data table. Complete parts (a) through (c) below. Click the icon to view the data table. Data table (a) State the hypotheses for determining if the mean concentration of calcium precipitation has changed since 1990. Ho: H 0.12 mg/L H₂: H # 0.12 mg/L 0.074 0.075 0.071 0.257 0.116 0.177 0.107 0.247 0.333 0.102 (b) Construct a 90% confidence interval about the sample mean concentration of calcium precipitation. The lower bound is The upper bound is. Print (Round to four decimal places as needed.) Done

Glencoe Algebra 1, Student Edition, 9780079039897, 0079039898, 2018
18th Edition
ISBN:9780079039897
Author:Carter
Publisher:Carter
Chapter10: Statistics
Section10.5: Comparing Sets Of Data
Problem 13PPS

Related questions
Question
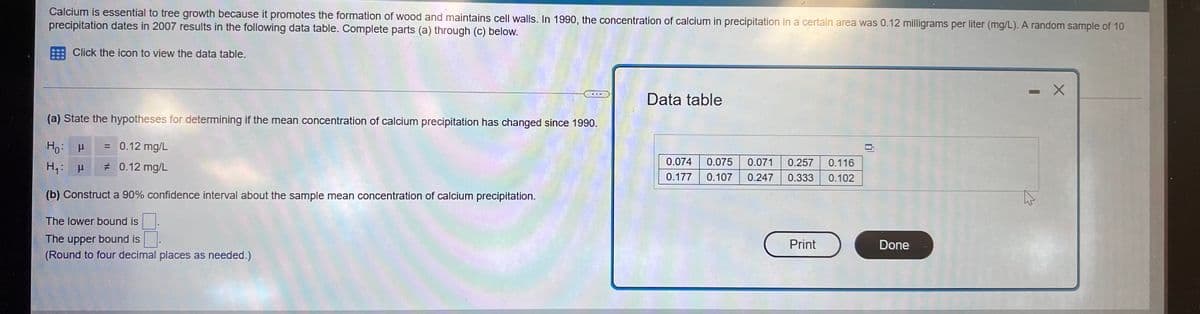
Transcribed Image Text:Calcium is essential to tree growth because it promotes the formation of wood and maintains cell walls. In 1990, the concentration of calcium in precipitation in a certain area was 0.12 milligrams per liter (mg/L). A random sample of 10
precipitation dates in 2007 results in the following data table. Complete parts (a) through (c) below.
Click the icon to view the data table.
-
Data table
(a) State the hypotheses for determining if the mean concentration of calcium precipitation has changed since 1990.
Ho: P
= 0.12 mg/L
H₁: μ
# 0.12 mg/L
0.074 0.075 0.071 0.257 0.116
0.177 0.107 0.247 0.333 0.102
(b) Construct a 90% confidence interval about the sample mean concentration of calcium precipitation.
The lower bound is
The upper bound is
Print
(Round to four decimal places as needed.)
Done
X
Expert Solution
This question has been solved!
Explore an expertly crafted, step-by-step solution for a thorough understanding of key concepts.

Step by step
Solved in 3 steps with 3 images

Recommended textbooks for you
Glencoe Algebra 1, Student Edition, 9780079039897…
Algebra
ISBN:
9780079039897
Author:
Carter
Publisher:
McGraw Hill
Glencoe Algebra 1, Student Edition, 9780079039897…
Algebra
ISBN:
9780079039897
Author:
Carter
Publisher:
McGraw Hill