Calculate 1/r and then complete the table. Next make a graph where Force is on the y-axis and 1/r is on the x-axis. To plot the graph use Excel or Google Sheets, whichever you prefer. 11. What is the slope (m from y = mx+b) of your graph? (Graph settings → click show best fit line) 12. What is the experimental value of k? (From the formula sheet) 13. Find the % error of your result. measured- real Percent Error = x100% real
Calculate 1/r and then complete the table. Next make a graph where Force is on the y-axis and 1/r is on the x-axis. To plot the graph use Excel or Google Sheets, whichever you prefer. 11. What is the slope (m from y = mx+b) of your graph? (Graph settings → click show best fit line) 12. What is the experimental value of k? (From the formula sheet) 13. Find the % error of your result. measured- real Percent Error = x100% real

Physics for Scientists and Engineers: Foundations and Connections
1st Edition
ISBN:9781133939146
Author:Katz, Debora M.
Publisher:Katz, Debora M.
Chapter23: Electric Forces
Section: Chapter Questions
Problem 15PQ: A charge of 36.3 nC is transferred to a neutral copper ball of radius 4.35 cm. The ball is not...

Related questions

Topic Video
Question
the graph corresponds with 11-13 please help im struggling
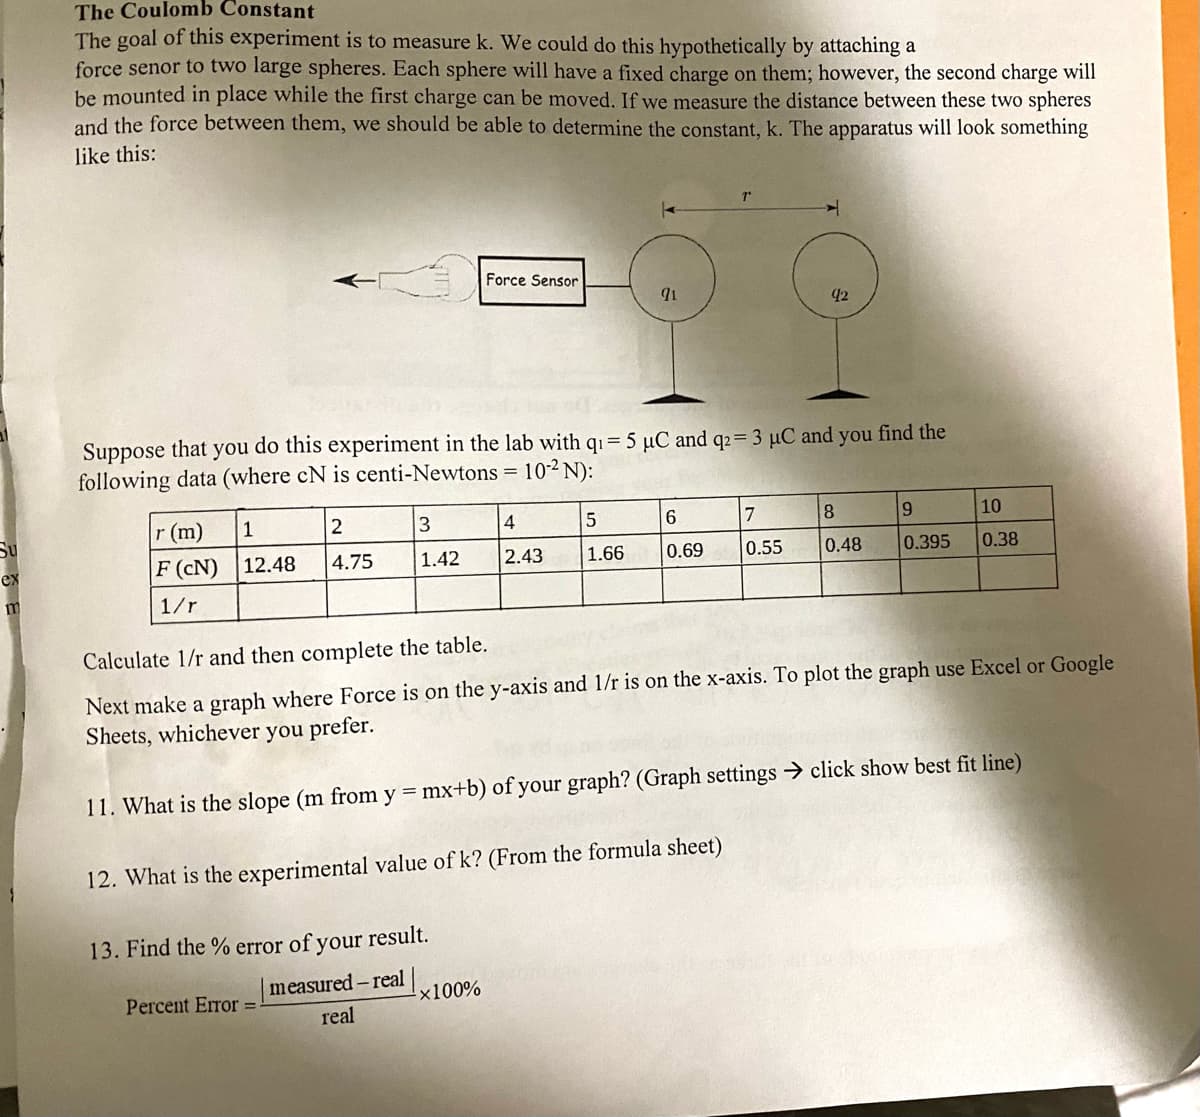
Transcribed Image Text:The Coulomb Constant
The goal of this experiment is to measure k. We could do this hypothetically by attaching a
force senor to two large spheres. Each sphere will have a fixed charge on them; however, the second charge will
be mounted in place while the first charge can be moved. If we measure the distance between these two spheres
and the force between them, we should be able to determine the constant, k. The apparatus will look something
like this:
Force Sensor
42
Suppose that you do this experiment in the lab with q1= 5 µC and q2= 3 µC and you find the
following data (where cN is centi-Newtons = 10-2 N):
r (m)
F (cN) 12.48
1
2
4
7
10
Su
4.75
1.42
2.43
1.66
0.69
0.55
0.48
0.395
0.38
ex
m
1/r
Calculate 1/r and then complete the table.
Next make a graph where Force is on the y-axis and 1/r is on the x-axis. To plot the graph use Excel or Google
Sheets, whichever you prefer.
11. What is the slope (m from y = mx+b) of your graph? (Graph settings → click show best fit line)
12. What
the experimental value of k? (From the formula sheet)
13. Find the % error of your result.
measured- real
Percent Error =
x100%
real
Expert Solution
This question has been solved!
Explore an expertly crafted, step-by-step solution for a thorough understanding of key concepts.

Step by step
Solved in 2 steps with 2 images

Knowledge Booster


Learn more about
Need a deep-dive on the concept behind this application? Look no further. Learn more about this topic, physics and related others by exploring similar questions and additional content below.Recommended textbooks for you
Physics for Scientists and Engineers: Foundations…
Physics
ISBN:
9781133939146
Author:
Katz, Debora M.
Publisher:
Cengage Learning

Physics for Scientists and Engineers: Foundations…
Physics
ISBN:
9781133939146
Author:
Katz, Debora M.
Publisher:
Cengage Learning