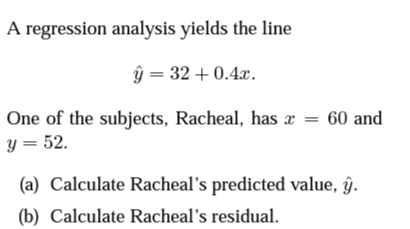
Calculate Racheal's predicted value, âŷ. O Calculate Racheal's residual.


Q: When two independent variables produce effects when combined that would not be present if each indep...
A: In a factorial design experiments as we can say when two independent variables produce effect when c...
Q: Thanks to an initiative to recruit top students, an administrator at a college claims that this year...
A: We have given that Sample size (n) = 16Sample mean (x̅) = 116Standard deviations (s) = 9Significance...
Q: To the right are the outcomes that are possible when a couple has three children. Refer to that list...
A: From the given table Find the given probabilities in ( a)(b) and (c )
Q: Which of the following values cannot be probabilities? 3/5, 5/3, 0.08, 1, 0, 2, -0.42, 1.29 Select a...
A: We know that the value of probability is lies between 0 and 1. Outside of this interval are not prob...
Q: After rolling doubles on a pair of dice three times in a row, your friend exclaims, "I cannot get do...
A: The outcomes for each of the die is {1, 2, 3, 4, 5, 6}.
Q: The extract of a plant native to Taiwan has been tested as a possible treatment for Leukemia. One of...
A: Given: Population mean, μ=73Population sd, σ=5.4
Q: significance, can it be concluded that the average age of the taxis in his company is less than the ...
A: It is given that Sample size n = 40 Sample mean M = 11.2 Population SD = 2.3 Level of significance =...
Q: Calculate Karl Pearson's coefficient of skewness from the following data : Weight (lbs.) No. of Stud...
A:
Q: Imagine that you actually do this regression (above) and you choose to run a semilogarithmic model. ...
A:
Q: Consider the Venn diagram shown below. Determine the following cardinalities. n(A)= ? n(C¯)= ? n...
A:
Q: Night price distribution of Airbnb appartements 750 500 250 100 200 300 price he prices of Air BnB a...
A: From the given Histogram we want to know it is normal or not
Q: A researcher wants to know how long it takes, on average, for a certain species of bacteria to divid...
A: Given data is 8.1,7.6,7.7,8.3,8.5,7.9,8.1,8.2,8.2,7.9,8.6,8,7.9,8.5,8.2,8.2,8sample size = 17standar...
Q: 3. The two most common type of errors made by programmers are syntax errors and errors in logic. For...
A: "Since you have posted a question with multiple subparts, we will solve first 3 sub-parts for you. T...
Q: Self-Reported Health Status Excellent 30 Very Good 80 Good 100 Fair 60 Рor 30 TOTAL 300
A: The true proportion of Americans, that falls in the health category status of "poor" is defined with...
Q: 4. A study was conducted among men in the United States in order to find out whether a mother’s use ...
A: Given information: Mothers had used hormones Mothers had not used hormones Sum Testicular can...
Q: (d) Find the area under the standard normal curve that lies to the left of -1.68. answer: (e) Find...
A:
Q: The time between calls is exponentially distributed with a mean time between calls of 9 minutes. (a)...
A:
Q: (a) Show the exponential smoothing forecasts using a = 0.1. (Round your answers to three decimal pla...
A: Given information:- Week Sales 1 17 2 21 3 20 4 24 5 18 6 17 7 20 8 17 9 23 1...
Q: A study was conducted among men in the United States in order to find out whether a mother’s use of ...
A: Given information: Mothers had used hormones Mothers had not used hormones Sum Testicular can...
Q: Compute by Fisher's Index Formula, the quantity index from the data given below : Commouity Price Va...
A:
Q: transformed to obtain ! X1-5 X2-5 V10 ' V10 Suppose the collection {X1, X2,..., Xn} with mean equal ...
A: Introduction: A collection of n random variables is given as, {X1, X2, …, Xn}.
Q: Tutorial Sheet No. (1) For the following data groups obtain : 1) Frequency distribution table. 2) f,...
A: Disclaimer : Since you have asked multiple question, we will solve the first question for you. If yo...
Q: Of all airline flight requests received by a certain discount ticket broker, 80% are for domestic tr...
A: Given: Probability for success(p)=0.80Number of flights(n)=3
Q: rrom the following ultimate class frequencies of the positive and negative classes and the total num...
A:
Q: The ranking of 10 students in two subjects A and B are as follows: A в A B 4 8. 9. 10 3 4 7 7 10 9. ...
A:
Q: 3.3 GRE Scores, Part I. Sophia took the Graduate Record Examination (GRE) and scored 160 on the Verb...
A: Introduction: Denote X1 as the random variable representing the score of a randomly selected student...
Q: QUESTION 6 A researcher believes that 25% of U.S. adult workers are satisfied with their jobs. To te...
A: Given : Claim : 25% of U.S adult workers are satisfied with their jobs Sample size (n) = 410 Let X :...
Q: In a police training exercise twelve new recruits are to break into six pairs for physical skill dri...
A:
Q: How many distinct permutations can be formed from the word "WEDNESDAY"? - In how many ways can 8 pe...
A: here use permutation and concept of total arrangement
Q: Imagine that you actually do this regression (above) and you choose to run a semilogarithmic model. ...
A: Given information: The slope of a regression equation is given.
Q: The number of customers, X, arriving in an A Poisson distribution with mean 6.5. Compute O P(X>4) = ...
A: Given: X : Number of customers λ=6.5
Q: uppose the returns on a particular asset are normally distributed. Also suppose the asset had an ave...
A: Given The data is as follows: Mean, μ=12.4%SD, σ=28.6%
Q: Kwame, a social psychologist, wants to know if people would commit mischievous acts if they knew the...
A: Hi! Thank you for the question, As per the honor code, we are allowed to answer three sub-parts at a...
Q: Ten percent of Americans are allergic to ragweed. Suppose a random sample of 200 people is selected....
A:
Q: Claim: More than 3.2% of homes have only a landline telephone and no wireless phone. Sample data: A ...
A: Given : Claim : More than 3.2% (0.032) of homes have only a landline telephone and no wireless hone ...
Q: Assume X is normally distributed with a mean of 7 and a standard deviation of 2. Determine the value...
A: Solution-: Let, x-be the random variable Given: μ=7,σ=2 We determine the value of x such that, (d) P...
Q: Find the mean and standard deviation of the following observations : X:1, 2, 4, 6, 8, 9 Transform th...
A:
Q: The number of claims in a year follows a Poisson distribution with mean 20. When there is a claim, t...
A: Poisson distribution occurs in business situations in which there are a few successes against a larg...
Q: The proportion p of residents in a community who recycle has traditionally been 70%. A policy maker ...
A: As per Bartleby guideline expert have to answer first three subparts only dear student please upload...
Q: a company manufactures two products x1 and x2 on three machines a, b, and c. X1 requires 1 hour on m...
A: Given is linear programming problem. We have to solve it using graphical method.
Q: following best describes a stratified sample of passengers?
A: A host on a cruise ship wants to collect data on the time passengers spend at various activities on ...
Q: garette smoking. In 2002, the prevalence of cigarette smoking among Americans was 21.1%. Data on eva...
A: Given: Sample size, n=3536proportion of respondents smoking currently , p^=0.136Population proportio...
Q: (b) Compare a three-month moving average forecast with an exponential smoothing forecast. Use a = 0....
A: here given data for 12 months here use exponential smoothing and 3 month moving average formula as s...
Q: The sodium content of twenty 300-gram boxes of organic cornflakes was determined. The data (in milli...
A: Given data is131.15,130.69,130.91,129.54,129.64,128.7,130.72,128.33,128.24,129.65,130.14,129.29,128....
Q: 3. It is claimed that a new diet will reduce a person's weight, on the average in a period of two we...
A:
Q: A college claims that the proportion, p , of students who commute more than fifteen miles to school...
A: From the given information we conduct Hypothesis test.
Q: In a random sample of 500 persons belonging to urban area 200 are found to be commuters of public tr...
A:
Q: These are all related to permutations, so I hope all three can be answered per your ruling. Thanks! ...
A: The three scenarios are given. We have to find relative permutations for all scenarios.
Q: Suppose that f(x) = e* for x > 0. Determine the following probabilities: Round your answers to 4 dec...
A: Givenf(x)=e-x ; x>0
Q: A consultant wants to ask workers at a factory about the workers' job satisfaction. Which of the fol...
A:

Step by step
Solved in 3 steps

- Olympic Pole Vault The graph in Figure 7 indicates that in recent years the winning Olympic men’s pole vault height has fallen below the value predicted by the regression line in Example 2. This might have occurred because when the pole vault was a new event there was much room for improvement in vaulters’ performances, whereas now even the best training can produce only incremental advances. Let’s see whether concentrating on more recent results gives a better predictor of future records. (a) Use the data in Table 2 (page 176) to complete the table of winning pole vault heights shown in the margin. (Note that we are using x=0 to correspond to the year 1972, where this restricted data set begins.) (b) Find the regression line for the data in part ‚(a). (c) Plot the data and the regression line on the same axes. Does the regression line seem to provide a good model for the data? (d) What does the regression line predict as the winning pole vault height for the 2012 Olympics? Compare this predicted value to the actual 2012 winning height of 5.97 m, as described on page 177. Has this new regression line provided a better prediction than the line in Example 2?For the following exercises, use Table 4 which shows the percent of unemployed persons 25 years or older who are college graduates in a particular city, by year. Determine whether the trend appears linear. If so, and assuming the trend continues, find a linear regression model to predict the percent of unemployed in a given year to three decimal places.bThe average rate of change of the linear function f(x)=3x+5 between any two points is ________.
- For the following exercises, consider this scenario: The profit of a company decreased steadily overa ten-year spam.The following ordered pairs shows dollars and the number of units sold in hundreds and the profit in thousands ofover the ten-year span, (number of units sold, profit) for specific recorded years: (46,600),(48,550),(50,505),(52,540),(54,495). Use linear regression to determine a function Pwhere the profit in thousands of dollars depends onthe number of units sold in hundreds.Find the equation of the regression line for the following data set. x 1 2 3 y 0 3 4If your graphing calculator is capable of computing a least-squares sinusoidal regression model, use it to find a second model for the data. Graph this new equation along with your first model. How do they compare?
- The following fictitious table shows kryptonite price, in dollar per gram, t years after 2006. t= Years since 2006 0 1 2 3 4 5 6 7 8 9 10 K= Price 56 51 50 55 58 52 45 43 44 48 51 Make a quartic model of these data. Round the regression parameters to two decimal places.A surgery intern has conducted a study of the sleeping habits of her colleagues and has developed a following regression equation: y-hat = 6 + 0.1X, where X is the number of hours working on one shift, and Y is the number of hours sleeping at night after that shift. Yvette worked 10 hours and slept 8 hours. What is Yvette’s residual? 0.1 1 6 7A carpenter wanted to predict how many pieces of furniture they could produce in a certain time frame. They calculated a linear regression equation and obtained the following results:Using these results how many pieces can they create in 5 hours? y^=2x+2
- Assume that there is a positive linear correlation between the variable R (return rate in percent of financial investment) and the variable t (age in years of the investment) given by the regression equation R = 2.5t + 5.3. 1- If the investment continues to grow at a constant rate, what is the expected return rate when the investment is 7 years old?The slope of the regression line represents the amount of change that is expected to take place in x when y increases by one unit. True FalseThe Linear regression is used to predict Y from X in a certain population. In this population, SSY is 50, the correlation between X and Y is .5, and N is 100. What will be the standard error of the estimate?


