Calculate the 95% confidence interval for the difference (mu1-mu2) of two population means given the following sampling results. Population 1: sample size = sample mean = 17.62, sample standard deviation = 3.25. Population 2: sample size = 17, sample mean = 15.57, sample standard deviation = 2.47. Yanıtınız: O 1.75 < mu1-mu2 < 2.36
Calculate the 95% confidence interval for the difference (mu1-mu2) of two population means given the following sampling results. Population 1: sample size = sample mean = 17.62, sample standard deviation = 3.25. Population 2: sample size = 17, sample mean = 15.57, sample standard deviation = 2.47. Yanıtınız: O 1.75 < mu1-mu2 < 2.36

Glencoe Algebra 1, Student Edition, 9780079039897, 0079039898, 2018
18th Edition
ISBN:9780079039897
Author:Carter
Publisher:Carter
Chapter4: Equations Of Linear Functions
Section: Chapter Questions
Problem 8SGR

Related questions
Question
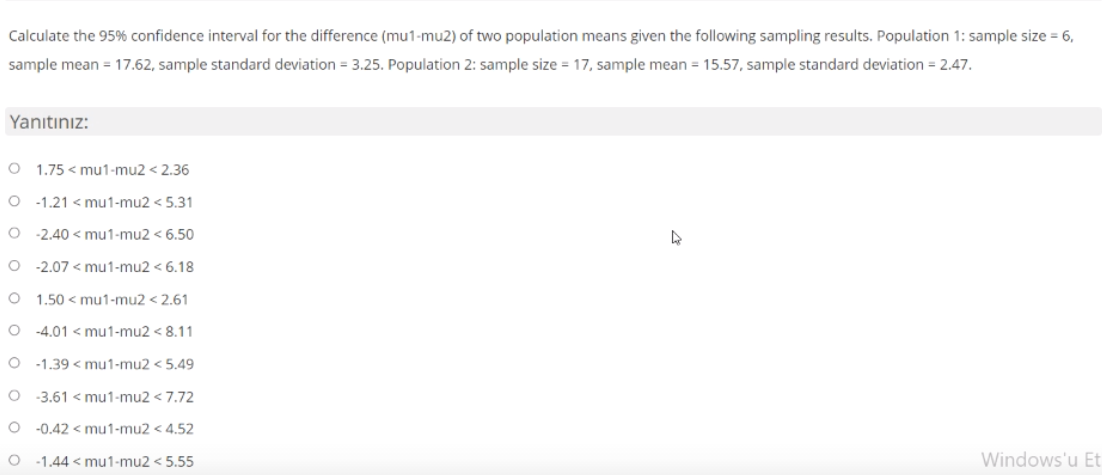
Transcribed Image Text:Calculate the 95% confidence interval for the difference (mu1-mu2) of two population means given the following sampling results. Population 1: sample size = 6,
sample mean = 17.62, sample standard deviation = 3.25. Population 2: sample size = 17, sample mean = 15.57, sample standard deviation = 2.47.
Yanıtınız:
O 1.75 < mu1-mu2 < 2.36
O -1.21 < mu1-mu2 < 5.31
O 2.40 < mu1-mu2 < 6.50
O -2.07 < mu1-mu2 < 6.18
O 1.50 < mu1-mu2 < 2.61
O -4.01 < mu1-mu2 < 8.11
-1.39 < mu1-mu2 < 5.49
O 3.61 < mu1-mu2 < 7.72
-0.42 < mu1-mu2 < 4.52
-1.44 < mu1-mu2 < 5.55
Windows'u Et
Expert Solution
This question has been solved!
Explore an expertly crafted, step-by-step solution for a thorough understanding of key concepts.

Step by step
Solved in 2 steps with 1 images

Recommended textbooks for you
Glencoe Algebra 1, Student Edition, 9780079039897…
Algebra
ISBN:
9780079039897
Author:
Carter
Publisher:
McGraw Hill
Glencoe Algebra 1, Student Edition, 9780079039897…
Algebra
ISBN:
9780079039897
Author:
Carter
Publisher:
McGraw Hill