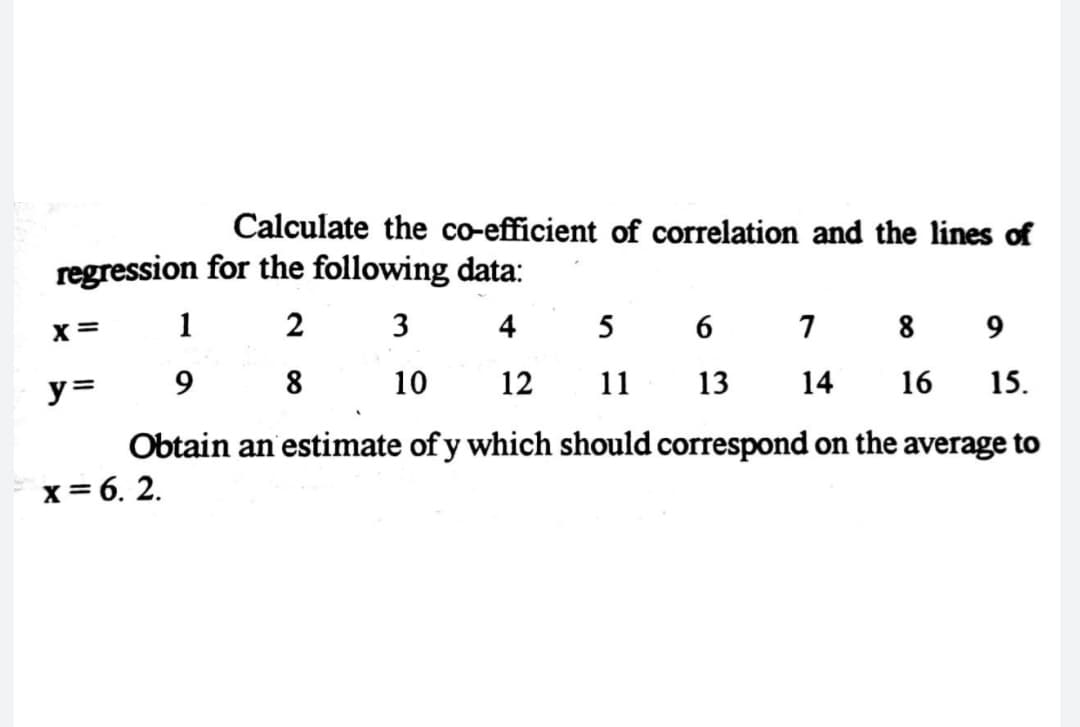
Calculate the co-efficient of correlation and the lines of regression for the following data: 1 2 3 4 5 7 8 9 X= y= 9. 10 12 11 13 14 16 15. Obtain an estimate of y which should correspond on the average to x = 6. 2.
Q: Find the (a) mean, (b) median, (c) mode, and (d) midrange for the data and then (e) answer the given...
A: Since you have posted a question with multiple sub-parts, we will solve first three subparts for you...
Q: ARCH(1) model o? = w+ ae?_1. Define Y; = e? and u: = e? – o?. Show that Y, can be written as a speci...
A: Given information: The parameters of ARCH model are given.
Q: A bag contains 10 white as well as black balls. A person draws 6 balls and finds that 3 balls are wh...
A:
Q: Subject- Statistics and Probability Construct the normal curve and determine the shaded regions of ...
A: GivenThe area to the left of z=1.33
Q: An event E has a probability p = p(E) = 0.6 in some sample space. Suppose the experiment that yields...
A:
Q: The middle interval that includes 0.85 fraction of z-scores is ± ________. a ± 1.44 b ± 1.47 c ± 1.5...
A:
Q: Subject- Statistics and Probability Construct the normal curve and determine the shaded regions of ...
A:
Q: The per capita energy consumption level (in kilowatt-hours) in a certain country for a recent year c...
A:
Q: Instruct. The random variable X represents the number of defective bulbs when 3 bulbs are tested. T...
A: It is given that the random variable X represents the number of defective bulbs when 3 bulbs are tes...
Q: What is the formula for a two tailed test?
A: In two-tailed test the critical area of a distribution is two-sided. If the sample being tested fal...
Q: Try and classify the following random variables as discrete or continuous. Each rande iable is assig...
A: Solution: Discrete variable: A discrete variable is the one which takes integral values and can on...
Q: 1. A fair six-sided die is to be rolled once. Let A be the event “an even number turns up" and B be ...
A:
Q: 10. Birth Weights of Boys Use these summary statistics for birth weights of 195 boys: x = 32.7 hg, s...
A: M = 32.7t = 1.97sM = √(6.62/195) = 0.47μ = M ± t(sM)μ = 32.7 ± 1.97*0.47μ = 32.7 ± 0.932
Q: The z-score interval that bounds a middle area of 0.75 is _____. a ± 1.08 b ± 1.10 c ± 1.13 d ± 1.15
A:
Q: Assume that among diabetics the fasting blood level of glucose is approximately normally distribute ...
A:
Q: Suppose I flip a fair coin n = 20 times. A psychic tries to predict the outcome before each flip. Th...
A:
Q: The probability distribution for X and Y is shown by the table. Find the marginal distribution funct...
A:
Q: Direction: For the following hypotheses name the IV and the DV. 1. Lack of sleep significantly affec...
A: In a correlation analysis, correlation means the relation between two variables and these two varia...
Q: A webassign.net Treatment Treatment Treatment A B. 32 45 32 29 42 36 29 43 34 27 45 37 33 50 41 Samp...
A:
Q: A coin is tossed six times. What is the probability of obtaining four or more heads ?
A:
Q: Find Geometric mean from the following distribution : х%3D4, 5, 6, 7, 8, 9. f= 2, 3, 4, 3, 2, 1.
A:
Q: Define Karl Pearson's coefficient of correlation and discuss the methods of studying it?
A: Correlation is a quantitative measure of the degree or strength of relationship that ,may exist betw...
Q: An x control chart with the 3-sigma control limits and sample size of n = 5 is used for monitoring a...
A:
Q: f it is glven that Σ κ= -100 , Σ-400, Σί -1000, Σ ί*- 5000 and N= 10, find the first four central mo...
A:
Q: A firm plans to bid $. 300 per kg. For a contract to supply 1,000 kg. Of a metal. It has two competi...
A:
Q: 20. Years in College Listed below are the numbers of years it took for a random sample of college st...
A:
Q: Under the normal curve, the areas at the tails are minimal. True or False
A: The provided statement is "True".
Q: 15. An Incomplete distribution is given below : Variable : 10-20 20-30 30-40 40-50 50-60 60-70 70-80...
A:
Q: In a sample of i000, the mean is found to be 17.5 and the standard deviation 2.5. In another sample ...
A: The z test is used to test the mean significance between the sample and population when the sample s...
Q: Based on the data provided by the Environmental Protection Agency (EPA) in New York, we are interest...
A: State the null and alternative hypotheses for the above research question.
Q: A home pregnancy test was given to women, then pregnancy was verified through blood tests. The follo...
A:
Q: 1)EITHER state the critical values and use the critical values/z-obtained comparison OR use the p-va...
A: Given that Population mean=3 Sample mean=3.03 Sample standard deviation =2.811 Sample size =1883 t...
Q: For a 4-unit class like Statistics, students should spend average of 12 hours studying for the class...
A:
Q: You just completed participation activities utilizing shadow price and the 100% rule. Now think of a...
A: First, let's define what shadow price and 100% rules are.100%rules states that the tot changes in th...
Q: A bag contains 5 white and 4 black balls. Two balls are drawn at random one after the other without ...
A: Given information: There are 5 white balls and 4 black balls Total number of balls is 5+4=9 Two ball...
Q: etermine the null and alternative hypotheses based on the following: A. According to the Centers for...
A: Hi! Thank you for the question, As per the honor code, we are allowed to answer three sub-parts at a...
Q: Say that we have two datapoints x and y. Both x and y are independently normally distributed with va...
A:
Q: 1. For the data 1, 2, 4, 6, 8, 12, and 15, which of the following measures of location (summary meas...
A:
Q: For a distribution Bowley's coefficient of skewness is -0.56, Q1 = 16.4 and median = 24.2. What is t...
A: GivenBowley's Coefficient of skewness(jB)=-0.56Q1=16.4Median=24.2
Q: When rs = 0.3 and x = 10. It was later discovered that the difference in ranks in two subjects by on...
A:
Q: The table summarizes results from 985 pedestrian deaths that were caused by automobile accidents. Pe...
A:
Q: A survey of used car salesmen revealed the following information: 69 wear white patent-leather shoes...
A:
Q: 21, 36, 40, 49. Find the value of geometric mean.
A:
Q: which of the following best describes where a results section is placed in a quantitative research p...
A: Quantitative research is exploratory rather than discovery. Quantitative research is mainly an explo...
Q: 15.25
A:
Q: Define the term System Service Rate?
A: Service System: It can be defined as A carrier system (or customer support system, CSS) is a configu...
Q: Subject- Statistics and Probability Instruc: A tennis player has to play 3 consecutive games. Answe...
A: Let X be the number of win game let p be the probability of win the game n=number of game
Q: C. Directions: Identify the sampling technique for cach scenario. Write your answer on the space pro...
A: Disclaimer : “Since you have posted a question with multiple sub-parts, we will solve first three su...
Q: Subject- Statistics and Probability Instruc: A tennis player has to play 3 consecutive games. Answe...
A: Given that A tennis player has to play 3 consecutive games. Win=W Lose=L
Q: Given the stem-and-leaf diagram. Answer the following questions: • The total frequency • Observation...
A: Stem and leaf plot is the device for presenting quantitative data in a graphical format.
Step by step
Solved in 3 steps with 3 images
- For the following exercises, use Table 4 which shows the percent of unemployed persons 25 years or older who are college graduates in a particular city, by year. Based on the set of data given in Table 5, calculate the regression line using a calculator or other technology tool, and determine the correlation coefficient. Round to three decimal places of accuracyFor a data set of brain volumes (cm^3) and IQ scores of eight males, the linear correlation coefficient is r= 0.848. Use the table available below to find the criticle values of r. Based on comparison of the linear correlation coefficient r and the critical values, what do you conclude about a linear correlation?Here is a bivariate data set.x y71 461 555 6148 -876 3126 7074 -62 Find the correlation coefficient and report it accurate to four decimal places.r =
- After a first-order model was fitted to the data, the coefficient of correlation between the usage in hours per week (x) of a particular brand of computer and the maintenance cost of the computer (y) is calculated as 0.84. Interpret the value of the coefficient of determination.Make up a table with five pieces of bivariate data and determine the correlation coefficient, r. Then switch the values of the x’s and y’s and compute the correlation coefficient. Has the value of r changed.The readout of the correlation is r = 0.8162 with a p-value of 0.0022. What does the scatterplot reveal that is missed from the correlation results?
- If the correlation coefficient r is equal to 0.321 , find the coefficient of determinationDetermine the critical r values and if the correlation is significantGiven the data in the image, what would the correlation coefficients be with and without the outlier? Would the inclusion of the outlier change the evidence for or against a significant linear correlation?
- Listed below are the overhead widths (in cm) of seals measured from photographs and the weights (in kg) of the seals. Construct a scatterplot, find the value of the linear correlation coefficient r, and find the critical values of r using α=0.01. Is there sufficient evidence to conclude that there is a linear correlation between overhead widths of seals from photographs and the weights of the seals?For a data set of brain volumes (cm3) and IQ scores of seven males, the linear correlation coefficient is r=0.807. Use the table available below to find the critical values of r. Based on a comparison of the linear correlation coefficient r and the critical values, what do you conclude about a linear correlation?Here is a sample of 20, the correlation between two variables is .5. Determine if this correlation is significant at the .05 level by calculating the t value