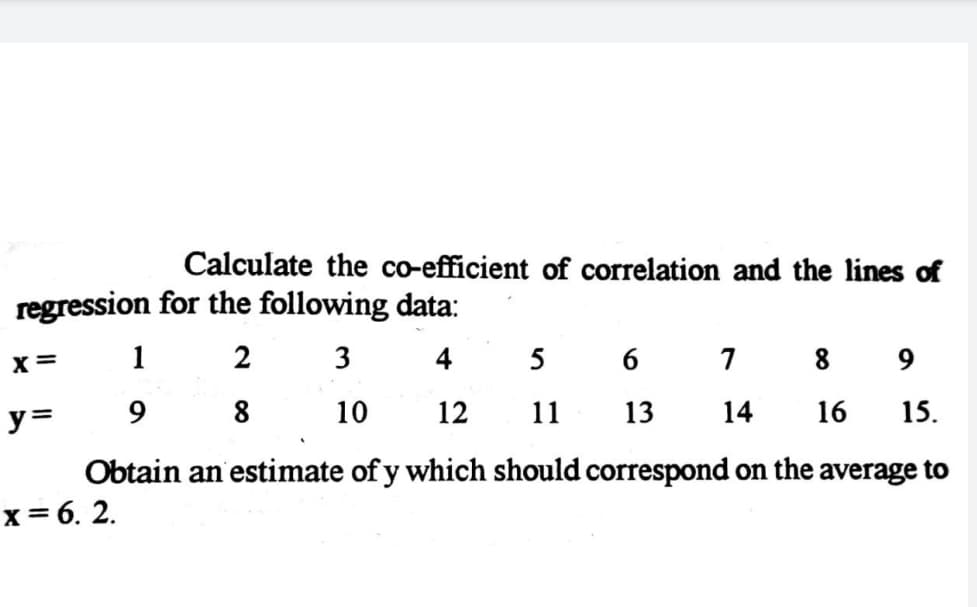
Calculate the co-efficient of correlation and the lines of regression for the following data: 1 2 3 4 5 6 8 y= 9 8 10 12 11 13 14 16 15. Obtain an estimate of y which should correspond on the average to x= 6. 2.


Q: statistics A random sample of 100 villages in a district, gives the mean population of 500 persons p...
A:
Q: A study conducted by the Center for Population Economics at the University of Chicago studied the bi...
A:
Q: A lottery exists where balls numbered 1 to 17 are placed in an urn. To win, you must match the five ...
A: We have to use permutation. Permutation is the arrangement of subjects in which order matters. Form...
Q: The population of 1000 clients consist of 800 Ilocanos, 150 Ibanags, 50 Ivatans. What sampling proce...
A: Here, we know that the population has been divided into finite number of clusters or groups and then...
Q: A project yields an average cash flow of 500 lakhs with a standard deviation of 60 lakhs. Calculate ...
A:
Q: The following cholesterol levels of 10 people were measured in mg/dl: 260, 150, 165, 201, 212, 243, ...
A: Given data is260,150,165,201,212,243,219,227,210,240
Q: The amount of coffee that people drink per day is normally distributed with a mean of 15 ounces and ...
A:
Q: A food snack manufacturer samples 11 bags of pretzels off the assembly line and weighs their content...
A:
Q: Comment on the following statements: (a) "99% of the people who drink beer die before reaching 100 y...
A:
Q: A service agency wishes to assess clients' views of quality service over the past year. Computer rec...
A: Simple random sampling: If a sample of n subjects is selected then every unit in the population has ...
Q: Construct the confidence interval for the population mean μ. c=0.90, x=15.5, σ=10.0, and n= 80 ...
A:
Q: Suppose 48 cars start at a car race. In how many ways can the top 3 cars finish the race? The number...
A:
Q: Question 34 Someone is mortal (H- people; M- mortal) O vx (Hx - -Mx) O vx (Hx - Mx) 3x (Hx &-Mx) O a...
A:
Q: 7. 8 10 11 12 13 14 15 16 17 18 data Based on the boxplot above, identify the 5 number summary (min,...
A: From the given box plot find 5 number summary and IQR
Q: Suppose there is a 11.9% probability that a randomly selected person aged 35 years or older is a jog...
A: Let J shows the event that a randomly selected person aged 35 years or older is a Jogger and F shows...
Q: Suppose there are two consumers, A and B, and two goods, X and Y. Consumer A's utility function is g...
A:
Q: You are given the following information relating to a frequency distribution comprising 10 observati...
A:
Q: Michael gets test grades of 73, 76, 82, and 87. He gets a 80 on her final exam. Find the weighted me...
A:
Q: ta) Find the mode of the following distribution: 1. 4. 3. 5. 6, 3, 3. 2, 4. 3. 4, 3, 3. 4, 4, 2, 3 (...
A:
Q: [Data Set: L06028] The following sample of 16 measurements was selected from a population that is ap...
A:
Q: Below are the range and standard deviation for a set of data. Use the range rule of thumb and compar...
A:
Q: A retail company has historically sold an average of 32 items per day. A local franchise is testing ...
A: Here is given that, n = 30 t-statistic is 13.69 Hypothesis is one tailed test.
Q: Construct the 98% confidence interval for the salaries of History professors at local private univer...
A: A range of values can be suggested with a certain amounts of confidence such estimates are called co...
Q: 4. The label on a can of pineapple slices states that the mean carbohydrate content per serving of c...
A:
Q: lease focus on the computation part only. Explain it and show to me how to encode it in MICROSOFT EX...
A:
Q: /For the below frequency distribution table calculate all the below reequipments. Class Frequency 2-...
A: Since you have posted a question with multiple sub-parts, we will solve first three subparts for you...
Q: The letters in the word MATHEMATICS are arranged randomly. Write your answers in decimal form. Round...
A:
Q: Suppose the age that children learn to walk is normally distributed with mean 12 months and standard...
A: Here is given that mean is 12 and standard deviation is 1.1 n = 13 We will use z-standard normal ...
Q: 6.96 [Data Set: LO6096] A random sample of n= 6 observations from a normal distribution resulted in ...
A: Given: n=6 95% CI x 8 2 3 7 11 6
Q: Mean and standard deviation of the following continuous series are 31 and 15.9 respectively. The dis...
A:
Q: How do you classify the distribution 15, 30, 18, 18, 27, 15, 15, 30, 18 based on its mode? Multimoda...
A:
Q: Many times, it is not easy or feasible to find the frequency of data from a very large dataset. So, ...
A: Given: 139, 145, 150, 145, 136, 150, 152, 144, 138, 138
Q: If random samples, cach with n- 25 scores, are selected from a normal population with u - 50 and o- ...
A:
Q: 2/18/22, 10:14 AM M2623 Worksheet 6 - Chapter 5(1).html 5. (5.7.4) A UMass Boston student has earned...
A: “Since you have posted a question with multiple sub-parts, we will solve first three subparts for yo...
Q: 28 Suppose the probability of an event is 37 What are the odds for the event happening? to What are ...
A: The probability of success is, The probability of failure is,
Q: A distribution of values is normal with a mean of 31.1 and a standard deviation of 27.8. Find P38, w...
A:
Q: A project yields an average cash flow of 500 lakhs with a standard deviation of 60 lakhs. Calculate ...
A:
Q: Find the area under the curve when z< 0.91. Select the correct response: O 0.1418 0.1814 O 0.4181 0....
A:
Q: According to a Survey, households in the city X spend an average of $24 per week on their leisure ac...
A: Given that μ = 24 , ?2 = 36 , n=100 Note: According to bartleby experts question answers guidelines...
Q: Xxample 10.5.7 In random samples of 600 and 1000 men from two cities, 400 and 600 men are respective...
A:
Q: Table 3: Significant Influence between Management Capability of Administrators and Productivity of E...
A: From the given information, Null Hypothesis: H0: There is no significance relationship between the ...
Q: Identify the two factors that determine the persuasiveness of evidence.How are these two factors rel...
A: Let P denote persuasiveness. Let E denote evidence. Let AP denote audit procedures. Let n denote sam...
Q: Give at least one example for each type of frequency distribution. Grouped frequency distribution ...
A: “Since you have posted a question with multiple sub-parts, we will solve first three subparts for yo...
Q: A ship carries 4 signal flags of different colors. How many different signals hoisting these flags o...
A:
Q: Consider the following scenario to understand the relationship between marginal and average values. ...
A:
Q: The probability that a tutor will see 0, 1, 2, 3, or 4 students 0 | 1 2 3 4 4 P(x) 1 5 ? 27 27 9 27 ...
A: X 0 1 2 3 4 P(X) 4/27 1/27 5/9 5/27
Q: The rank correlation coefficient of a debating contest involving 10 participants was calculated as 0...
A:
Q: The accompanying dataset provides the closing prices for four stocks and the stock exchange over 12 ...
A: Given information: The time series data is given.
Q: Which graphical technique or chart should be used if the researcher is interested in comparing the p...
A: Given data Occupation category Frequency Occupation group 1 4 Occupation group 2 26 Occupat...
Q: In a recent study on world happiness, participants were asked to evaluate their current lives on a s...
A:

Step by step
Solved in 4 steps with 2 images

- For the following exercises, use Table 4 which shows the percent of unemployed persons 25 years or older who are college graduates in a particular city, by year. Based on the set of data given in Table 5, calculate the regression line using a calculator or other technology tool, and determine the correlation coefficient. Round to three decimal places of accuracyFor a data set of brain volumes (cm^3) and IQ scores of eight males, the linear correlation coefficient is r= 0.848. Use the table available below to find the criticle values of r. Based on comparison of the linear correlation coefficient r and the critical values, what do you conclude about a linear correlation?Determine the critical r values and if the correlation is significant
- Here is a bivariate data set.x y71 461 555 6148 -876 3126 7074 -62 Find the correlation coefficient and report it accurate to four decimal places.r =find the linear correlation coefficent and the critical value(s)For a data set of brain volumes (cm3) and IQ scores of seven males, the linear correlation coefficient is r=0.807. Use the table available below to find the critical values of r. Based on a comparison of the linear correlation coefficient r and the critical values, what do you conclude about a linear correlation?
- After a first-order model was fitted to the data, the coefficient of correlation between the usage in hours per week (x) of a particular brand of computer and the maintenance cost of the computer (y) is calculated as 0.84. Interpret the value of the coefficient of determination.Listed below are the overhead widths (in cm) of seals measured from photographs and the weights (in kg) of the seals. Construct a scatterplot, find the value of the linear correlation coefficient r, and find the critical values of r using α=0.01. Is there sufficient evidence to conclude that there is a linear correlation between overhead widths of seals from photographs and the weights of the seals?The readout of the correlation is r = 0.8162 with a p-value of 0.0022. What does the scatterplot reveal that is missed from the correlation results?
- Make up a table with five pieces of bivariate data and determine the correlation coefficient, r. Then switch the values of the x’s and y’s and compute the correlation coefficient. Has the value of r changed.Here is a bivariate data set.x8570.36366.470.2 y48.574.7-56.66253.9 Find the correlation coefficient and report it accurate to three decimal places. r =If the correlation coefficient r is equal to 0.321 , find the coefficient of determination