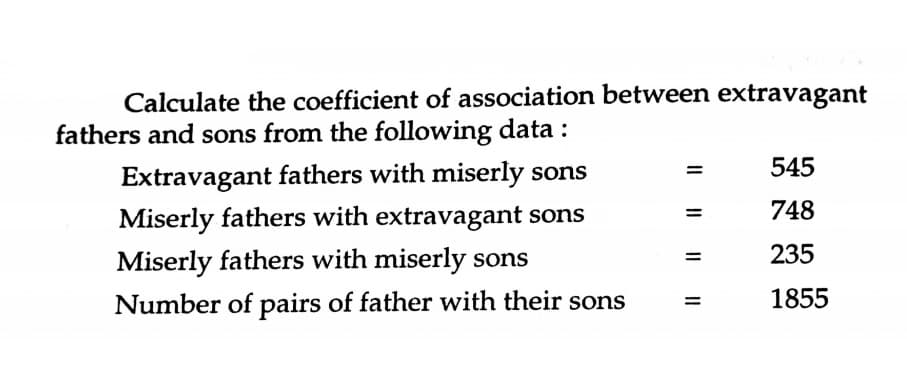
Calculate the coefficient of association between extravagant fathers and sons from the following data : 545 Extravagant fathers with miserly sons Miserly fathers with extravagant sons Miserly fathers with miserly sons 748 %3D 235 Number of pairs of father with their sons 1855


Q: 15 12 18 14 rical data as a forecast for the next period, compute the following. (Round your an erro...
A: *Answer:
Q: The average student loan debt for college graduates is $25,850. Suppose that that distribution is no...
A: Given X~N(μ=25850, σ=10900)
Q: A company that makes cola drinks states that the mean caffeine content per 12-ounce bottle of cola i...
A:
Q: Determine which candidate will win using the Borda count method. Rankings for Club President Fr...
A: Rankings for Club President Franco 1 4 2 1 3 Jurdan 4 1 3 3 2 Tarshikov 3 2 4 2 1 Va...
Q: Kahuna's Credit Union conducted a survey as to how long customers claimed to wait in the checkout li...
A: x 0.5 1.75 2 2.25 2.25 2.5 2.75 3.25...
Q: The hypothesis shown below is being tested. The test statistic calculated by the analyst was Z = +1....
A: The test statistic is 1.76 This is a two-tailed test as the direction of alternative hypothesis is "...
Q: How many students liked apricots, cantaloupes or bananas? b. How many students liked apricots or ba...
A: Here use venn diagram A group of 65 students were surveyed, and it was found that each of the stud...
Q: 1. The Central Limit Theorem allows for a researcher to: a. estimate the sampling distribution of a...
A: The objective is to choose correct alternative for given questions.
Q: Illustration 15.15. The table below gives the data regarding number of students appearing the pass p...
A:
Q: With a view to study whether the working condition in a factory had any influence on the frequency o...
A:
Q: Fill in the P (X=x) values to give a legitimate probability distribution for the discrete random var...
A:
Q: A researcher wanted to find out whether IQ is a function of family size. The speculation was that a...
A: Here researcher is doing an observational study in which he had categorical/grouping variable as fam...
Q: 5. Which of the following changes will increase the power of a statistics test: a. Change alpha from...
A: The power value in a statistical test plays an important role, that it checks how probability that t...
Q: In a statistics class, 10 scores were randomly selected, and the following results were obtained: 74...
A: Solution:1) Arranging Observations in the ascending order, We get :65,66,67,68,71,73,74,77,77,77Here...
Q: A researcher wished to find out whether the perceptions of a persons height depends on that person’s...
A: The objective of the researcher was to find whether the perception of a person's height by the army ...
Q: 3. Determine whether or not the data set appear to be from a population with a normal distribution b...
A:
Q: If the number of degrees of freedom for a chi-square distribution is 32, what is the population mean...
A: We have given that, Number of degrees of freedom from chi- square distribution (df) = 32 Then, We ...
Q: In a random sample of seven people, the mean driving distance to work was 22.1 miles and th...
A:
Q: Find the standard deviation of the sampling distribution of sample means using the given information...
A:
Q: The reading speed of second grade students in a large city is approximately normal, with a mean of 9...
A:
Q: Using the data below, determine the linear regression equation & R2 value of this paracetamol analys...
A: Given: Concentration Absorbance 6 3.69267 8 3.69667 10 3.69667 12 3.701 14 3.708 16 ...
Q: At pandemic time of COVID 19 surveys are conducted in two townships which fall into the same Lusaka ...
A: Given: No. of positive tested people in Chawama, x1 =175 Sample size, n1=318 No. of positive tested ...
Q: Library patrons in a large metropolitan area were questioned about extending library hours. 43.7% o...
A: Binomial distribution : The probability of obtaining x successes in the n independent trails of Bin...
Q: (a) Consider the random variable Y(1) min{Y1,..., Y,n}. Verify that the density function for Y(1) is...
A:
Q: Ex 438 Ey 279 Ex2 32264 Ey2 13059 Exy 20493 r.800 (b) Use a 5% level of significance to test the cla...
A: Given, x y 67 44 64 41 75 48 86 51 73 44 73 51
Q: Women's shoe sizes are (approximately) normally distributed, with an average size of 8.076 and a sta...
A: Given,mean(μ)=8.076standard deviation(σ)=1.468sample size(n)=10
Q: Let X denote the distance (m) that an animal moves from its birth site to the first territorial vaca...
A: Given The cumulative distribution function of X is
Q: Calculate geometric mean from the following data: 125 1462 38 7 0.22 0.08 12.75 0.5
A:
Q: With examples, briefly explain the following inferential statistics concepts; (a) Point estimate (b)...
A: “Since you have posted a question with multiple sub-parts, we will solve first three subparts for yo...
Q: Giving a test to a group of students, the grades and gender are summarized below A В Total Male 10 1...
A:
Q: Question 7 A new sneaker claims that it can make male athletes jump higher. A sample of 34 male athl...
A:
Q: 4. The table below gives the purchasing power of the dollar as measured by consumer prices according...
A: Given data, Year Consumer prices 1983 1.003 1984 0.961 1985 0.928 1986 0.913 1987 0.88 ...
Q: Use the Hypergeometric formula: A high school graduation committee is to be formed by choosing ran...
A:
Q: The following is a list of 14 measurements. - 13, -6, -45, 53, –3, 83, –23, 79, – 17, –96, – 18, 91,...
A: Given: A list of 14 measurements. -13,-6,-45,53,-3,83,-23,79,-17,-96,-18,91,53,-13
Q: The summarised results of a class at an annual examination are given below : 83% of the students pas...
A:
Q: A medical researcher wants to compare the pulse rates of smokers and non-smokers. He believes that t...
A:
Q: the data attached, please fill in BOTH blanks: The slope increases from 3,330 to ____ dollars/carat ...
A: Slope = SP/SSx Intercept = My- slope *Mx My= mean of y Mx= mean of x
Q: (a) Assuming a linear regression model for the year (X) and SAT score (Y), please f regression coeff...
A: a) From the given information, X=year Y=Average SAT score Excel Procedure: Enter X and Y data in Ex...
Q: C. Determine whether the underlined value is a parameter or a statistic. 11. In a national survey on...
A: Given : There are different examples Where to find which is statistic and parameter
Q: The correlation coefficient, r, developed by Karl Pearson in the early 1900s, is numerical and provi...
A: We have given that the statement about to the correlation coefficient ’r’ developed by Karl Pearson.
Q: A psychologist is interested in constructing a 99% confidence interval for the proportion of people ...
A: Givenx=73n=831p^=xn=73831=0.0878confidence level = 99%
Q: A new sneaker claims that it can make male athletes jump higher. A sample of 32 male athletes were a...
A: Given' sample size n=32 sample mean xbar=1.72 standard deviations=0.81 then to find lower limit ...
Q: Question 2 There are hundreds of apples on the trees, so you randomly choose just 85 apples and get ...
A:
Q: A Gallup survey based on telephone and face-to-face interviews with 4,220 adults in China, aged 15 a...
A: We have given that Sample size n =4220 Sample proportion p^=30%=0.30 Margin of error =E =2.4%=0.024
Q: A health coach tested the effectiveness of a new behavioral therapy for weight loss among college st...
A:
Q: The distribution of scores on the SAT is approximately normal with a mean of u = 500 and standard de...
A: As per guideline expert have to answer first question three subparts only dear student please upload...
Q: How do you write a research questionnaire?
A: The objective is to write the steps in a research hypothesis.
Q: The number of people arriving per hour at the emergency room (ER) of a local hospital seeking medica...
A: Given The number of people arriving per hour at the emergency room (ER) of a local hospital seeking ...
Q: Below is a probability distribution for the number of math failures of BC students. 1 3 4 P(X) .41 ....
A: We know that ∑P(x) = 1 First we want to find missing probability from above equation. NOTE:- Acco...


Trending now
This is a popular solution!

Step by step
Solved in 2 steps

- The National Safety Council of the U.S. released the following data on the incidence rates for fatal or lost-worktime injuries per 100 employees for several industries in three recent years. Compute r for each pair of years and determine which years are most highly correlated. Calculate r using 1. the formula and 2. function. Industry Year 1 Year 2 Year 3 Textile 0.46 0.48 0.69 Chemical 0.52 0.62 0.63 Communication 0.9 0.72 0.81 Machinery 1.5 1.74 2.1 Services 2.89 2.03 2.46 Nonferrous metals 1.8 1.92 2 Food 3.29 3.18 3.17 Government 5.73 4.43 4 By formula By Function By formula By Function r1 r2 r3 Please provide a step by step of calculation in excelto give me an understaning on how to calculate in future Thank you in advanceThe following data show the number of class sessions missed during a semester of SOC221 and the final grade for a sample of 8 students selected at random. Number of Sessions Missed Final Grade (x) (y) 0 96 2 88 12 68 6 91 8…Compute the coefficient of correlation by using the table below showing the grades of 12 learners on 2 tests in Math (X) and Science (Y) by the use of the following: a.) Spearman’s Formula; and b.) Rank-Difference Method. Student Test X Test Y 1 73 70 2 83 84 3 89 94 4 66 72 5 73 68 6 92 90 7 80 87 8 83 92 9 73 76 10 61 66 11 63 64 12 78 76
- Consider the following data on marks obtained in Quizzes 1 and 2 by a sample of 10 studentsenrolled in a statistics classQuiz 1 Quiz 25 2015 1612 1213 1015 1414 1513 1012 1210 1215 14 for the marks in each quiz calculate covariance correlation coefficientFrom the following data, test whether there is any association betweenintelligence and economic conditions of 1000 students.EconomicConditionIntelligenceExcellent Good Medium Dull TotalGood 48 200 150 80 478Not good 52 180 190 100 522Total 100 380 340 180 1000A researcher is interested in testing the relationship between smoking and BMI (kg/m2) in adults aged 30-45. In order to test this association, the researcher divides smoking into currently more than a pack a day, currently less than a pack a day, and never smokers. The following table represents the BMIs for each participant enrolled by their respective smoking category. Current Smoker (≥1pack/day) Current Smoker (<1 pack/day Never Smoked 26.7 29.4 22.1 29.4 28.6 30.4 24.3 27.4 21.3 28.4 23.2 26.4 21.6 20.1 19.7 27.4 20.6 19.8 26.8 19.7 21.6 36.4 19.6 22.3 31.5 21.6 24.3 27.4 21.5 *Continue as though all assumptions for ANOVA are met. A) Calculate the MSW and MSB for the data represented above. B) Carry out a formal test for a one-way analysis of variance among the groups and interpret your results.
- The management of the local zoo wants to know if all of their animal exhibits are equally popular. If there is significant evidence that some of the exhibits are not being visited frequently enough, then changes may need to take place within the zoo. A tally of visitors is taken for each of the following animals throughout the course of a week, and the results are contained in the following table. At α=0.025, determine whether there is sufficient evidence to conclude that some exhibits are less popular than others. Animal Exhibits at the Zoo Elephants Lions/Tigers Giraffes Zebras Monkeys Birds Reptiles Number of visitors 164 166 172 188 165 139 142 Copy Data Step 3 of 4 : Compute the value of the test statistic. Round any intermediate calculations to at least six decimal places, and round your final answer to three decimal places.The management of the local zoo wants to know if all of their animal exhibits are equally popular. If there is significant evidence that some of the exhibits are not being visited frequently enough, then changes may need to take place within the zoo. A tally of visitors is taken for each of the following animals throughout the course of a week, and the results are contained in the following table. At α=0.005, determine whether there is sufficient evidence to conclude that some exhibits are less popular than others. Animal Exhibits at the Zoo Elephants Lions/Tigers Giraffes Zebras Monkeys Birds ReptilesNumber of visitors 152 175 185 144 145 171 163 Step 2 of 4 : Calculate the expected value for the number of visitors for the birds exhibit. Enter your answer as a fraction or a decimal rounded to three decimal places. Step 3 of 4: Compute the value of the test statistic. Round any calculations to at least six decimals places and round your final answer to three…A sample of men and women who had passed their driver's test either the first time or the second time were surveyed, with the following results: Results of the driving testGender First time Second timeMen 126 211Women 135 178a) Do these data suggest that there is a relationship between gender and the passing of their driver’s test from which the present sample was drawn? Let alpha=.05
- (a) Is a sample correlation coefficient ρ = 0.83 significant at the α = 0.01 level based on a sample size of n = 4 data pairs? What about n = 14 data pairs? (Select all that apply.) Yes, because the absolute value of the given correlation coefficient is greater than or equal to that for a sample size of n = 4 and α = 0.01. No, because the absolute value of the given correlation coefficient is smaller than that for a sample size of n = 14 and α = 0.01. No, because the absolute value of the given correlation coefficient is smaller than that for a sample size of n = 4 and α = 0.01. No, because the absolute value of the given correlation coefficient is greater than or equal to that for a sample size of n = 14 and α = 0.01. Yes, because the absolute value of the given correlation coefficient is greater than or equal to that for a sample size of n = 14 and α = 0.01. No, because the absolute value of the given correlation coefficient is greater than or equal to that for a sample size of n =…Consider the following datax -5 -4 -3 -2 -1 0 1 2 3 4 5Y - 125 - 64 - 27 -8 -1 0 1 8 27 64 125a. Calculate the correlation between x and y, and perform a hypothesis test to determine if the correlation is significantly greater than zero. Use a significance level of 5%.b. Are you willing to conclude that there is a strong linear association between the two variables? Use at least one graph to support your answer, and to explain why or why not.Marine biologists have noticed that the color of the outermost growth band on a clam tends to be related to the time of year in which the clam dies. A biologist conducted a small investigation of whether this is true for the species Protothaca staminea. She collected a sample of 50 clam shells in February and 27 clam shells in March. 15 of the shells from February had a dark color on the outermost growth band, whereas 8 of the shells from March had a dark color on the outermost growth band. Carry out a hypothesis test to see if there is a difference in the proportion of shells with a dark outermost growth band between the two months. The point estimate for the true difference in proportion of dark growth bands between February and March is: