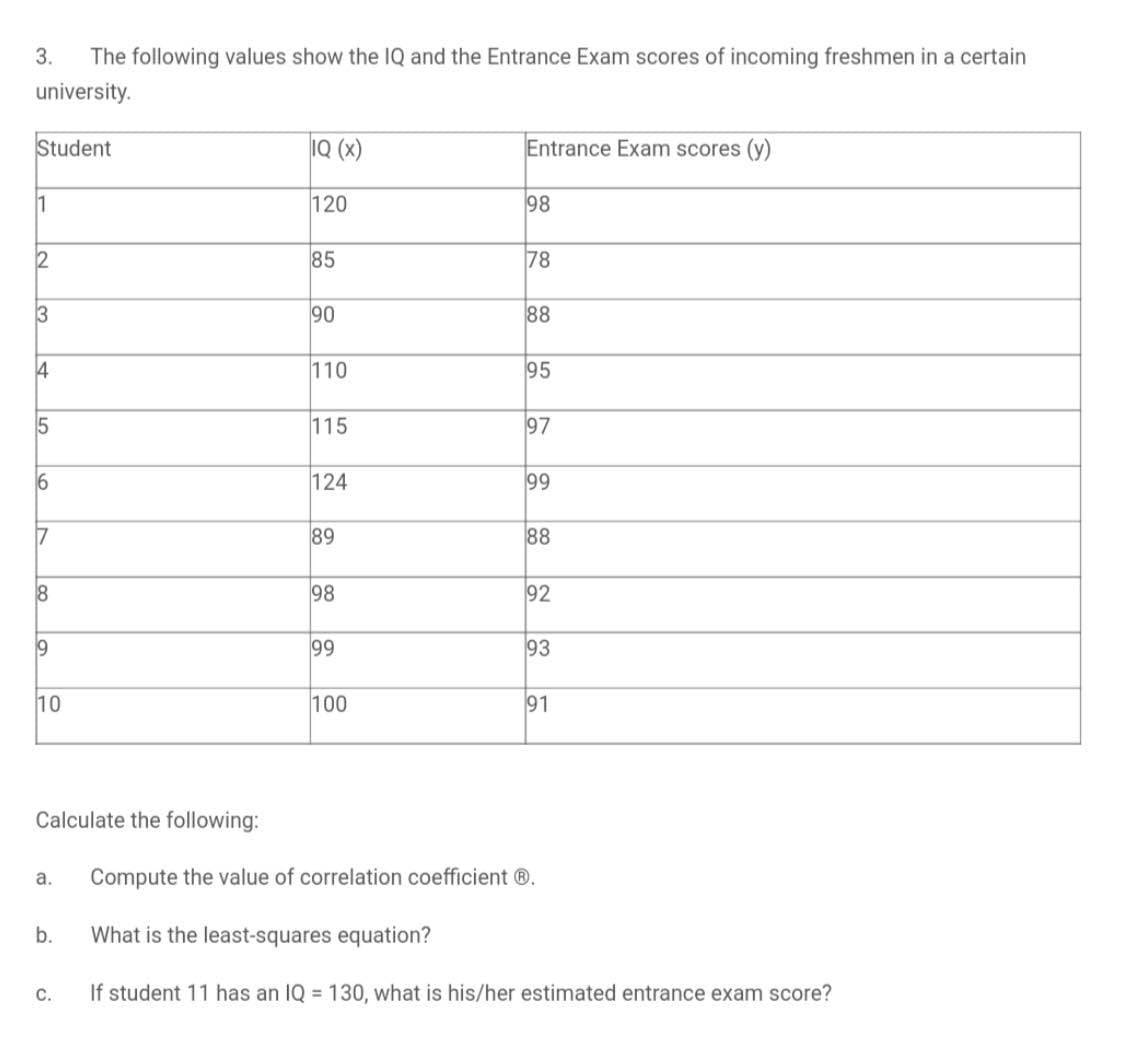
Calculate the following: a. Compute the value of correlation coefficient Ⓡ. What is the least-squares equation? C. If student 11 has an IQ = 130, what is his/her estimated entrance exam score? b.


Q: Assume that you are interested in whether or not expenditures per pupil are related to the average…
A: According to guidelines we solve first three subparts when given multiple subparts.
Q: to estimate the mean age of movie patrons such that it can be said with 98% confidence that the…
A:
Q: Americans drank an average of 23.2 gallons of bottled water per capita in 2004. If the standard…
A:
Q: The department head of a private secondary school in Marikina City surveyed randomly selected…
A: Given that The department head of a private secondary school in Marikina City surveyed randomly…
Q: Assume that the two samples are independent simple random samples selected from normally distributed…
A:
Q: In a study, researchers wanted to measure the effect of alcohol on the hippocampal region, the…
A: Given data The researchers randomly selected 19 adolescentsThe alcoholic adoloscents were less than…
Q: 12. The following are the length of sleep (in hours) of twelve (12) service crew of a fast-food…
A:
Q: Suppose that P(A | B) = 0.71, P(A|B') = 0.82, and P(B) = 0.23. Determine P(BIA). Round your answer…
A:
Q: Find the 86% confidence interval of the population mean.
A: It is given that Sample size n = 164 Sample mean M = 3200 Population SD = 215 The critical value of…
Q: The amount of pollutants that are found in waterways near large cities is normally distributed with…
A: GivenMean(μ)=8.6standard deviation(σ)=1.3sample size(n)=39
Q: Given the frequency distribution, compute for each quantile and match it with the letter code of its…
A: Find Q2 =? D7 = ? P75 = ?
Q: The table below shows the list of COVID-19 vaccine prizes as of January 2021. Find the following:…
A: Since, the question number to be solved is not mentioned, we'll be solving the first question only.…
Q: 14. What is the critical value if there is a 95% confidence level and the given sample size is 25?…
A:
Q: The manager of a restaurant in a commercial building has determined that the proportion of customers…
A: Given data n=100 p=14%=0.14
Q: The round off errors when measuring the distance that a long jumper has jumped is uniformly…
A: Given a=0 b=4.8
Q: Cite five (5) research questions used in real life and formulate your null and alternative…
A: From the given information we find the solution.
Q: The data show the chest size and weight of several bears. Find the regression equation, letting…
A: Excel procedure to compute least-squares regression line: Enter the data of Chest size (x) and…
Q: Explain why you would or wouldn’t agree with each of the following statements: (a) In the presence…
A: Note: In case of multiple parts, as per the guidelines answer to first three subparts must be…
Q: Consider the following hypothesis test. Ho: # 12 Ha: #> 12 A sample of 25 provided a sample mean -…
A: " since you have posted a question with multiple sub-parts, we will solve the first three subparts…
Q: A geologist is conducting a study on 3 types of rocks to measure their weight and comparing the…
A: Formula : F = MSB/MSW
Q: 1. Cans of LaCroix are supposed to contain 355 milliliters (ml). There is some variation for each…
A:
Q: Suppose that a number is randomly chosen from the interval (-3, 3). What is the probability that the…
A: Solution
Q: What is the probability of selling at least 10 P(x ≥ 10) = What is the probability of selling 5 or…
A: “Since you have posted a question with multiple sub-parts, we will solve first three subparts for…
Q: The average teacher's salary in North Dakota is $35,441. Assume a normal distribution with o= $5100.…
A: Given, Mean, μ = 35441 Standard deviation, σ = 5100 Z = X-μσ
Q: 2. A recent report on elementary schools in Kent county claimed that 13% of elementary students…
A: Given data number of success , x= 17 sample size, n =80 population proportion,p= 0.13
Q: 36. Find mode from the following data. older aniquor Classes 10- 20- 30- 40- 50- 60- 70- 80-90- 19…
A: The above inclusive series is converted into exclusive series in the following manner. Classes…
Q: Consider a drug that is used to help prevent blood clots in certain patients. In clinical trials,…
A: From the provided information, Sample size (n) = 6047 From which 150 developed the adverse reaction…
Q: 2. (i) (ii) Prove the following results : cov (x2, x1.23)=cov (x3, x1.23)=0, cov (E 1.23, X1-23) =…
A:
Q: A statistics class with 60 students were given an examination and the results are shown below. 73 57…
A: Results of 60 students were given, we need to make a frequency distribution table.
Q: A senior high school teacher is interested in knowing the average number of hours a teacher works in…
A: A senior high school teacher is interested in knowing the average number of hours a teacher works in…
Q: Students in an experimental psychology class did research on depression as a sign of stress. A test…
A: The answer is attached below,
Q: the shoreline. g. 26% of the time a person will wait at least how long before the wave crashes in?…
A:
Q: = Consider the hypothesis test Ho: o o2 against H₁: o<o2 respectively. Suppose that the sample sizes…
A: We use f test statistic. F= s12/s22 Calculated value of f for the above information is F= 23.2/28.8…
Q: Suppose that this function represents a continuous uniform distribution over the interval 1/3≤x≤k.…
A: Given: fx=76 , 13≤x≤k
Q: D and E? Thank you very much.
A: Year number 2003 813 2004 941 2005 962 2006 1053 2007 1132 2008 1194 2009 1205 2010…
Q: Distinguish Experimental Conditions from Experimental Unit.
A: Given information: Experimental Conditions from Experimental Unit.
Q: You want to obtain a sample to estimate how much parents spend on their kids birthday parties. Based…
A: It is given that confidence level is 0.98, the population standard deviation is 35.1 and the margin…
Q: Find the area under the standard normal distribution curve between z= -1.86 and z=2.59. Use The…
A:
Q: Consider the hypothesis test Ho: o2 = 02 against H₁: o² <o2 respectively. Suppose that the sample…
A: Given : n1 = 10 s1²= 28.8 n2 = 5 s2²= 23.2
Q: Researchers watched groups of dolphins to determine what activities the dolphins partake in at…
A: Given: Activity Morning Noon Afternoon Evening Total Travel 19 13 14 15 61 Feed 30 20 14 54…
Q: Is the type of area that a person lives in a factor in the age that a person experiences their first…
A: Given data Rural Suburbs City 19 17 12 17 18 11 13. 15…
Q: A researcher is interested in finding out the factors affecting the probability that a candidate…
A:
Q: Use hurwicz criteria to determine the appropriate decision .Weight of 0.6 to the worst case…
A: a) Given that the coefficient of pessimism = 0.6, the coefficient of optimism can be calculated as…
Q: Suppose that a number is randomly chosen from the interval (-6,2). What is the probability that…
A:
Q: 08:00 AM INJVC > Module 2 Assessments > Chapt If an orange tree sapling is planted, it has a 80%…
A:
Q: Suppose that a number is randomly chosen from the interval (-6,6). What is the probability that…
A:
Q: i ca after participating in an aerobic exercise program and swi wn in the following table: Blood…
A: *Answer: Open a.Reject the Null Hypothesis. 5.465 > 1.761is the correct answer. * Explanation:
Q: 1. Complete the frequency distribution below. Grades 95-99 90-94 85-89 80-84 75-79 II. Complete the…
A: Solution-: We want to (a) Complete the given frequency distribution table (b) Find Q3=? (c) Find…
Q: Researchers wondered if there was a difference between males and females in regard to some common…
A: Given Data n1 = 522 x1 = 202 n2 = 505 x2 = 171
Q: Regarding Normal Approximation to the Binomial, one rule states that the Normal Approximation…
A: The question is about normal approximation to the binomial

Step by step
Solved in 2 steps with 2 images

- In a study measuring the relationship between height in centimeters and annual income in dollars, it has been determined that for Group 1, r2 =0.15 and for Group 2, r2 =0.10 where r denotes the correlation between the two variables. Least-squares regression lines are fitted to the observations from each group. Which of the following statement is true: A. There could be a positive relationship between the two variables for Group 1 and a negative relationship between the two variables for Group 2 B. The sum of the residuals for Group 1 is greater than the sum of the residuals for Group 2. C. Measuring the height in inches would increase the value of r2 for both groups. D. None of the answer options is true Can you also explain the difference between r and r2, and why least square regressions are used?The following data shows the yearly income (in $1000) and age of a sample of seven individuals. Income (in $1000) Age 20 18 24 20 24 23 25 34 26 24 27 27 34 27 Develop the least squares regression equation. Estimate the yearly income of a 30-year old individual. Compute the coefficient of determination. Use a t test to determine whether the slope is significantly different from zero. Use level of significance as 0.05.Here is a bivariate data set.xy182425915011737106295223812246 Find the correlation coefficient and report it accurate to four decimal places. r =
- The following table shows how many weeks a sample of 6 persons have worked at an automobile inspection station and on any given day: a) Find the least squares estimators and the values for a and b ??? = ___________ ? = ___________ ??? = ___________ ? = ___________ ??? = ___________ b) Determine AND WRITE the equation for the best fit line. c) Find the correlation coefficient, r, and describe the relationship between weeks in the program and time improvement.The following summary statistics resulted from a study of the relationship between the cost ofa barrel of crude oil (x) and the price of a gallon of regular unleaded gasoline (y).n = 12x 241.1 y 14.34 4,932.82 x 17.288 2 y xy 291.55(1) Compute the sample correlation r and use it to judge the strength of linear relationshipbetween x and y.(2) Obtain the equation of the least squares line, and interpret its slope and intercept.(3) Predict the price of a gallon of regular unleaded gasoline when the cost of a barrel of crudeoil is 50.The following data shows the yearly income (in $1000) and age of a sample of seven individuals. Income (in $1000) Age 20 18 24 20 24 23 25 34 26 24 27 27 34 27 a. Develop the least squares regression equation. b. Estimate the yearly income of a 30-year old individual. c. Compute the coefficient of determination. d. Use a t test to determine whether the slope is significantly different from zero. Use level of significance as 0.05.
- Consider the following data: Fit a line, y = x1 + x2t, to the data using the least squares approach.The following table shows the annual sales revenue of 12 firms and their expenditure on the market research. Sales revenue (£ 000) Expenditure on market research (£ 000) 24 1.2 20 0.8 18 1.1 14 0.8 19 0.9 13 0.5 25 1.3 26 1.5 30 1.4 34 1.6 24 1.2 20 0.8 Calculate the Pearson correlation coefficient between the two variables, to two…Here is a bivariate data set. x y -2.6 120.6 30.5 34.9 40.1 85.3 18.2 82.2 14.8 89.6 21.8 69.3 36.3 49.9 49.1 25.7 32.3 56.6 52.2 -8.4 Use technology to find the correlation coefficient and report it accurate to three decimal places.
