
Survey of Accounting (Accounting I)
8th Edition
ISBN:9781305961883
Author:Carl Warren
Publisher:Carl Warren
Chapter7: Fixed Assets, Natural Resources, And Intangible Assets
Section: Chapter Questions
Problem 7.4MBA

Related questions
Question
Calculate the following ratio
Liquid ratio.
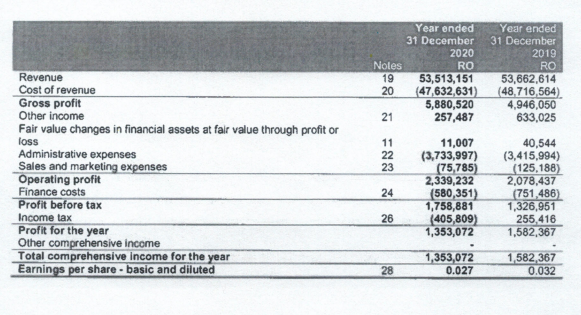
Transcribed Image Text:Year ended
31 December
Year ended
31 December
2020
2019
RO
53,662,614
(48,716,564)
4,946,050
633,025
Noles
19
20
RO
53,513,151
(47,632,631)
5,880,520
257,487
Revenue
Cost of revenue
Gross profit
Other income
Fair value changes in financial assets at fair value through profit or
loss
Administrative expenses
Sales and marketing expenses
21
11,007
(3,733,997)
(75,785)
2,339,232
(580,351)
1,758,881
(405,809)
1,353,072
11
22
23
40,544
(3,415,994)
(125,188)
2,078,437
(751,486)
1,326,951
255,416
1,582,367
Operating profit
Finance costs
Profit before tax
Income tax
Profit for the year
Other comprehensive income
Total comprehensive income for the year
Earnings per share - basic and diluted
24
26
1,353,072
0.027
1,582,367
0.032
28
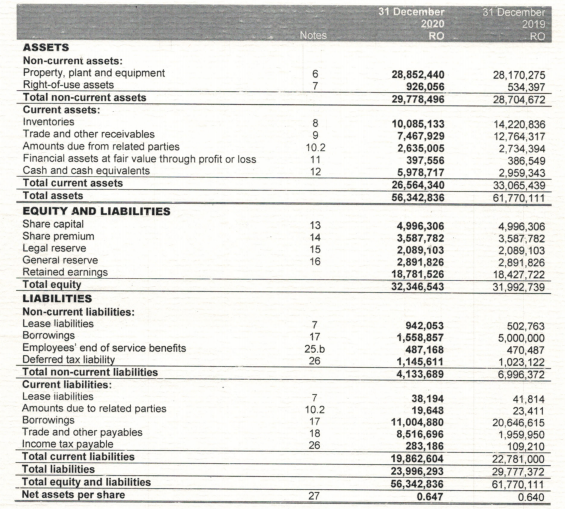
Transcribed Image Text:31 December
2020
RO
31 December
2019
RO
Notes
ASSETS
Non-current assets:
Property, plant and equipment
Right-of-use assets
Total non-current assets
Current assets:
28,852,440
926,056
29,778,496
28,170,275
534,397
7
28,704,672
Inventories
Trade and other receivables
Amounts due from related parties
Financial assets at fair value through profit or loss
Cash and cash equivalents
Total current assets
8
10,085,133
7,467,929
2,635,005
397,556
5,978,717
26,564,340
56,342,836
14,220,836
12,764,317
2,734,394
386,549
2,959,343
33,065,439
61,770,111
10.2
11
12
Total assets
EQUITY AND LIABILITIES
Share capital
Share premium
Legal reserve
General reserve
Retained earnings
Total equity
13
14
15
16
4,996,306
3,587,782
2,089,103
2,891,826
18,781,526
32,346,543
4,996,306
3,587,782
2,089, 103
2,891,826
18,427,722
31,992,739
LIABILITIES
Non-current liabilities:
Lease liabilities
7
Borrowings
Employees' end of service benefits
Deferred tax liability
Total non-current liabilities
942,053
1,558,857
487,168
1,145,611
4,133,689
502,763
5,000,000
470,487
1,023,122
6,996,372
17
25.b
26
Current liabilities:
Lease iabilities
Amounts due to related parties
Borrowings
Trade and other payables
Income tax payable
Total current liabilities
Total liabilities
Total equity and liabilities
Net assets per share
7
38,194
19,643
11,004,880
8,516,696
283,186
19,862,604
23,996,293
56,342,836
0.647
41,814
23,411
20,646,615
1,959,950
109,210
22,781,000
10.2
17
18
26
29,777,372
61,770,111
0.640
27
Expert Solution
This question has been solved!
Explore an expertly crafted, step-by-step solution for a thorough understanding of key concepts.

Step by step
Solved in 2 steps

Knowledge Booster


Learn more about
Need a deep-dive on the concept behind this application? Look no further. Learn more about this topic, finance and related others by exploring similar questions and additional content below.Recommended textbooks for you
Survey of Accounting (Accounting I)
Accounting
ISBN:
9781305961883
Author:
Carl Warren
Publisher:
Cengage Learning
Survey of Accounting (Accounting I)
Accounting
ISBN:
9781305961883
Author:
Carl Warren
Publisher:
Cengage Learning