FINANCIAL POSITION AS AT 31ST DECEMBER 2020 RM('000) RM('000) Non- Curent Assets Property, plant and equipment Investment property Investment in equity instruments Investment in debt instruments 2,140 1,590 350 250 4.330 Current assets Inventories Trade receivables Other receivables Deposits and prepayments Cash at bank and in hand 440 443 90 40 188 1.201 Total Assets 5.531 |Equity Share capital Share premium Retained 600 50 ofits Total equity 343 993 Non-current liabilities Bank borrowings Financial liabilities 2,565 879 Deferred tax liabilities Total non-current liabilities 179 3.623 Current liabilities Trade payables 325 Аcсuals and other 115 payables Bank borrowings Current tax liabilities Total Current liabilities Total liabilities Total Equity and Liabilities 355 120 915 4,538 5,531
FINANCIAL POSITION AS AT 31ST DECEMBER 2020 RM('000) RM('000) Non- Curent Assets Property, plant and equipment Investment property Investment in equity instruments Investment in debt instruments 2,140 1,590 350 250 4.330 Current assets Inventories Trade receivables Other receivables Deposits and prepayments Cash at bank and in hand 440 443 90 40 188 1.201 Total Assets 5.531 |Equity Share capital Share premium Retained 600 50 ofits Total equity 343 993 Non-current liabilities Bank borrowings Financial liabilities 2,565 879 Deferred tax liabilities Total non-current liabilities 179 3.623 Current liabilities Trade payables 325 Аcсuals and other 115 payables Bank borrowings Current tax liabilities Total Current liabilities Total liabilities Total Equity and Liabilities 355 120 915 4,538 5,531

Financial Accounting
15th Edition
ISBN:9781337272124
Author:Carl Warren, James M. Reeve, Jonathan Duchac
Publisher:Carl Warren, James M. Reeve, Jonathan Duchac
Chapter2: Analyzing Transactions
Section: Chapter Questions
Problem 24E: The following data (in millions) were taken from the financial statements of Costco Wholesale...

Related questions
Question
Practice Pack
Calculate the following Ratios:
d) Quick Acid Ratio
e) Inventory Turnover Ratio (Days)
f)
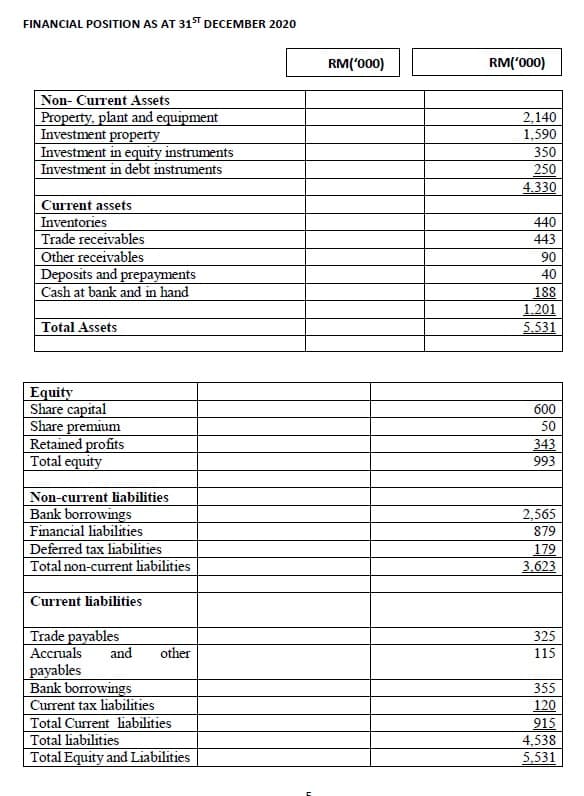
Transcribed Image Text:FINANCIAL POSITION AS AT 31' DECEMBER 2020
RM('000)
RM('000)
Non- Curent Assets
Property, plant and equipment
Investment property
Investment in equity instruments
Investment in debt instruments
2,140
1.590
350
250
4.330
Current assets
Inventories
Trade receivables
Other receivables
Deposits and prepayments
Cash at bank and in hand
440
443
90
40
188
1.201
5.531
Total Assets
Equity
Share capital
Share premium
Retained profits
Total equity
600
50
343
993
Non-current liabilities
Bank borrowings
Financial liabilities
Deferred tax liabilities
Total non-current liabilities
2,565
879
179
3.623
Current liabilities
Trade payables
325
Асспals
and
other
115
payables
Bank borrowings
Current tax liabilities
Total Current liabilities
Total liabilities
Total Equity and Liabilities
355
120
915
4,538
5,531
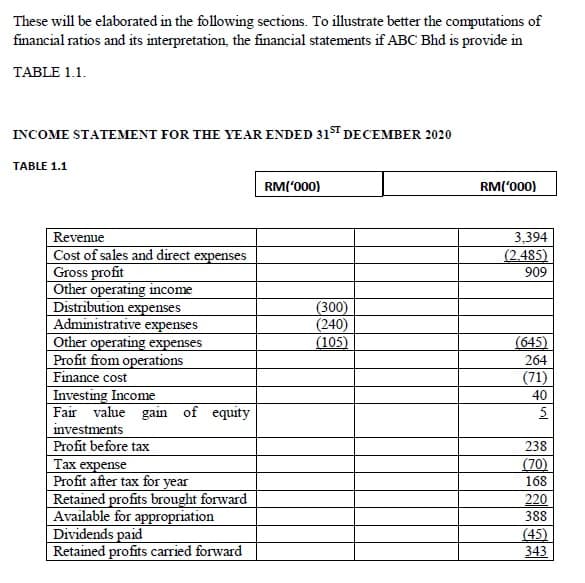
Transcribed Image Text:These will be elaborated in the following sections. To illustrate better the computations of
financial ratios and its interpretation, the financial statements if ABC Bhd is provide in
TABLE 1.1.
INCOME STATEMENT FOR THE YEAR ENDED 31ST DECEMBER 2020
TABLE 1.1
RM('000)
RM('000)
Revenue
Cost of sales and direct expenses
Gross profit
Other operating income
Distribution expenses
Administrative expenses
Other operating expenses
Profit from operations
Finance cost
3,394
(2.485)
909
(300)
(240)
(105)
(645)
264
(71)
Investing Income
Fair value gain of equity
investments
Profit before tax
Тах expense
Profit after tax for year
Retained profits brought forward
Available for appropriation
Dividends paid
Retained profits carried forward
40
5
238
(70)
168
220
388
(45)
343
Expert Solution
This question has been solved!
Explore an expertly crafted, step-by-step solution for a thorough understanding of key concepts.

Includes step-by-step video

Learn your way
Includes step-by-step video

Step by step
Solved in 4 steps

Knowledge Booster


Learn more about
Need a deep-dive on the concept behind this application? Look no further. Learn more about this topic, accounting and related others by exploring similar questions and additional content below.Recommended textbooks for you
Financial Accounting
Accounting
ISBN:
9781337272124
Author:
Carl Warren, James M. Reeve, Jonathan Duchac
Publisher:
Cengage Learning

Cornerstones of Financial Accounting
Accounting
ISBN:
9781337690881
Author:
Jay Rich, Jeff Jones
Publisher:
Cengage Learning

Financial Accounting
Accounting
ISBN:
9781305088436
Author:
Carl Warren, Jim Reeve, Jonathan Duchac
Publisher:
Cengage Learning
Financial Accounting
Accounting
ISBN:
9781337272124
Author:
Carl Warren, James M. Reeve, Jonathan Duchac
Publisher:
Cengage Learning
Cornerstones of Financial Accounting
Accounting
ISBN:
9781337690881
Author:
Jay Rich, Jeff Jones
Publisher:
Cengage Learning
Financial Accounting
Accounting
ISBN:
9781305088436
Author:
Carl Warren, Jim Reeve, Jonathan Duchac
Publisher:
Cengage Learning

Financial Accounting: The Impact on Decision Make…
Accounting
ISBN:
9781305654174
Author:
Gary A. Porter, Curtis L. Norton
Publisher:
Cengage Learning

Principles of Accounting Volume 1
Accounting
ISBN:
9781947172685
Author:
OpenStax
Publisher:
OpenStax College