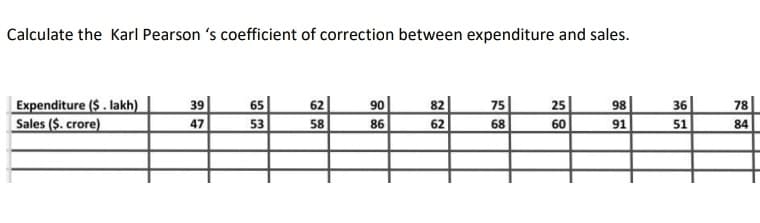
Calculate the Karl Pearson 's coefficient of correction between expenditure and sales.


Q: The following are the monthly figures of advertising expenditure and sales of a firm. It is generall...
A:
Q: Let the random variable X be the number of rooms in a randomly chosen owner- occupied housing unit i...
A:
Q: Classify the type of random variable: Blood types collected in a donation drive O continuous O not a...
A:
Q: Consider the following sample data. Sample A: Sample B: Sample C: 11, 22, 33 81, 92, 103 1,100; 1,11...
A:
Q: A random sample of 20 binomial trials resulted in 9 successes. Test the claim that the population pr...
A:
Q: In how many ways can a committee of four people be chosen out of nine people? O 36 O126 O 8,709,120 ...
A:
Q: Given the sample data below, use the defining formula to compute the sample standard deviation. 21 1...
A: Given,21, 17, 32, 12, 22, 12sample size(n)=6sample mean(x¯)=21+17+32+12+22+126sample mean(x¯)=1166sa...
Q: 10. Tell whether the given values represent a Probability Distribution or not. P(1) = 1/4 , P(2) = 1...
A: 10)Given data is P(1)=14,P(2)=18,P(3)=14,P(5)=18
Q: The highway fuel economy of a 2016 Lexus RX 350 FWD 6-cylinder 3.5-L automatic 5-speed using premium...
A:
Q: Construct a Probability Distribution and compute for the Mean, Variance and Standard deviation Y 2 3
A:
Q: Problem 3 a) The sales data of the company 'Abysmal' were $10,000 in 2018, $8,000 in 2019, $5000 in ...
A: Let Si be the sales data corresponding to the ith time point . Let the years 2018,2019,2020,2021 and...
Q: In a study of 387,979 cell phone users, it was found that 133 developed cancer of the brain or nerv...
A:
Q: Group Statistics Respondents sex Mean Std. Deviation Std. Error Mean Number of hours worked MALE 792...
A: Given The data is as follows:
Q: Question 12 It is the field of statistics that deals with the analysis of the small group of data wh...
A: Inferential statistics: The process of making inference about a population based on the sample taken...
Q: Example 4-28. (Buffon's Needle Problem). A vertical board is ruled with horizontal parallel lines at...
A:
Q: For a data set of brain volumes (cm) and IQ scores of four males, the linear correlation coefficient...
A:
Q: A popular fashion magazine claims that the age of their subscribers is normally distributed with a m...
A:
Q: The speed with which utility companies can resolve problems is very important. GTC, the Georgetown T...
A:
Q: 3. Let X be a random variable with the following probability distribution: 5 10 15 20 25 X P(X) 0.5 ...
A: X 5 10 15 20 25 P(X) 0.5 0.30 0.25 0.25 0.15
Q: a. any three banners can be hung? b. the first is a triangular banner while the last is a rectangula...
A: HERE AS PER POLICY I HAVE CALCULATED 3 SUBPARTS PLZ REPOST FOR REMAINING Here Given Rectangular ban...
Q: Question 20 In a study of the effectlof computer games to academic performance, which of the followi...
A: A variable (which is not a variable of interest), that is essentially considered constant, since its...
Q: E 4. Body Temperature The given expression is used for determining the likelihood that the average (...
A: Note- Since you have posted multiple questions, as per our guidelines we are supposed to answer only...
Q: A random sample of 26 items is drawn from a population whose standard deviation is unknown. The samp...
A:
Q: Choose the best statement to summarize the association shown between hat size and IQ in the scatterp...
A: A scatterplot is used to show the relationship between two variables.
Q: 4. To the left of z = 2
A:
Q: Find the specified areas for a N(0, 1) density. (a) The area above z = -2.13 Round your answer to fo...
A:
Q: Find the mode of the following distribution : |Class interval| 0–10 10-20 20–30 30-40 40–50 | 50-60 ...
A: Given data is Clas Frequency (f) 0 - 10 5 10 - 20 8 20 - 30 7 30 - 40 12 40 - 50 28 5...
Q: Find the standard deviation of the data set: 15, 42, 53, 7, 9, 12,14, 28,47. 16.78
A: Given data is ,15, 42, 53, 7, 9, 12, 14, 28, 47sample size(n)=9sample mean(x¯)=15+42+53+7+9+12+14+28...
Q: Because the total population in 2050 is much larger than the Comparison of Population in the United ...
A: Given: Age Group 1950 2050 Under 10 years 29.3 56.2 10 to 19 years 21.8 56.7 20 to 29 yea...
Q: Find the mean, variance and standard deviation for the probability distribution given below: X0 2 P(...
A: mean=E(X)=∑X.P(X)
Q: The histogram below represents the number of television sets per household for a sample of US. house...
A: Given frequency histogram is
Q: Calculate the standard error. May normality be assumed? (Round your answers to 4 decimal places.) St...
A: Calculate the standard error .May normality be assumed
Q: 2. Let X be a random variable with the following probability distribution: -4 1 P(X)| 0.2 0.3 0.4 0....
A:
Q: For all of the variability calculations we have done (including range, sum of squares, variance, and...
A: Solution-: For all of the variability calculations we have done (including range, sum of squares, va...
Q: Suppose you just received a shipment of fourteen televisions. Four of the televisions are defective....
A:
Q: Suppose that the random variables Y1 and Y2 have joint probability density function, fV1, y2), giver...
A: Given: fy1, y2=6y12y2, 0≤y1≤y2, y1+y2≤20, Otherwise Required P(Y2 < 1.1 | Y1 ...
Q: Suppose that Z~N(0,1). Then find Pr(2.78 < Z < 2.84). You may use Excel. Please enter your answer as...
A:
Q: Let x be the average number of employees in a group health insurance plan, and let y be the average ...
A:
Q: Find the (a) mean, (b) median, (c) mode, and (d) midrange for the data and then (e) answer the given...
A: Data given 39,60,60,65,65,65,75,95,100,115,175,175,250,259,275,275,350,400,450,475,475,475,475,2000...
Q: From the data please state the intervals and what this tells us about the silver content between coi...
A: Given that μ1 mean of Coin 1 μ2 mean of coin 2 Difference μ1-μ2 90% Confidence interval for differe...
Q: What could be the possible values of the random variable below? Frequency of absences of a student f...
A:
Q: A sample of university students has an average GPA of 2.78 with a standard deviation of 0.45. What ...
A: We have given that, Let X be the GPA scores from normal distribution with average or mean (μ) = 2.7...
Q: Compute Pearson's r wth the definitional formula and use 4 decimal places for all computations. str...
A: We have given that, Stress (X) : 9, 8, 2, 8, 8 Exam scores (Y) : 6, 2, 6, 4, 6 Then, We...
Q: Click here for the Excel Data File (a) Find the mean, median, and mode. (Round your answers to 2 dec...
A: given data : 32,99,47,31,26,20,69,14,26,48,9,24,57,2,10,18,51,25,5,87,17,28,47,14,40,17
Q: In a random sample of 500 employees of ABC, Inc., 225 are females. It is considered that there has b...
A: In a random sample of 500 employees of ABC, Inc., 225 are females. It is considered that there has b...
Q: Question 17 It is the process of relating a model that exists between observed variables. O Correlat...
A: Correlation is a statistical technique that can show whether and how strongly pairs of variables are...
Q: For a binomial distribution with n = 5 and p = 0.4, what is P(X 1)?
A:
Q: What could be the possible values of the random variable below? Amount of blood in a regular bag wit...
A:
Q: For any age t > 0 you are given Po (120 – 1)(1+ 150) %3D 18000 Calculate u, For t-94. Keep five digi...
A: The notation p0t raepresents the probability of a person aged 0 will survive for the next t years. A...
Q: Scores on a common final exam are normally distributed with a mean of 66 and a standard deviation of...
A:

Step by step
Solved in 2 steps

- Urban Travel Times Population of cities and driving times are related, as shown in the accompanying table, which shows the 1960 population N, in thousands, for several cities, together with the average time T, in minutes, sent by residents driving to work. City Population N Driving time T Los Angeles 6489 16.8 Pittsburgh 1804 12.6 Washington 1808 14.3 Hutchinson 38 6.1 Nashville 347 10.8 Tallahassee 48 7.3 An analysis of these data, along with data from 17 other cities in the United States and Canada, led to a power model of average driving time as a function of population. a Construct a power model of driving time in minutes as a function of population measured in thousands b Is average driving time in Pittsburgh more or less than would be expected from its population? c If you wish to move to a smaller city to reduce your average driving time to work by 25, how much smaller should the city be?Calculate the (Pearson) correlation coefficient between production volume and total costs in this problem. * a.) 0.8391 b.) 0.9571 c.) 0.9160 d.) 0.9783Table A: average monthly expenditure (in Rand) on fuel to power domestic generators by 20 households3 000 1 500 2 000 2 500 1 800 1 100 3 900 2 300 2 100 1 6002 900 1 400 1 800 2 200 1 900 3 800 3 600 3 100 2 700 1 800
- From the data given below, calculate Yule's coefficient of association between weight of children and their economic condition, and interpret it. Rich Children Poor Children Below Normal weight 75 23 Above Normal weight 42 42An analysis of production rejects resulted in the following figures: (attached) Calculate Karl Pearson’s coefficient of skewness and comment on the results.The number of pounds of steam used per month by a chemical plant is thought to be related to the average ambient temperature (in F) for that month. The past year’s usage and temperatures are in the following table: Month Temp. Usage/1000 Month Temp. Usage/1000 Jan. 21 185.79 July. 68 621.55 Feb. 24 214.47 Aug. 74 675.06 Mar. 32 288.03 Sept. 62 562.03 Apr. 47 424.84 Oct. 50 452.93 May 50 454.58 Nov. 41 369.95 June 59 539.03 Dec. 30 273.93 Find a 99% CI for β1.
- The number of pounds of steam used per month by a chemical plant is thought to be related to the average ambient temperature (in F) for that month. The past year’s usage and temperatures are in the following table: Month Temp. Usage/1000 Month Temp. Usage/1000 Jan. 21 185.79 July. 68 621.55 Feb. 24 214.47 Aug. 74 675.06 Mar. 32 288.03 Sept. 62 562.03 Apr. 47 424.84 Oct. 50 452.93 May 50 454.58 Nov. 41 369.95 June 59 539.03 Dec. 30 273.93 Test for significance of regression using α=0.01 (Use ANOVA). Calculate the r2 of the model. Find a 99% CI for .The number of pounds of steam used per month by a chemical plant is thought to be related to the average ambient temperature (in F) for that month. The past year’s usage and temperatures are in the following table: Month Temp. Usage/1000 Month Temp. Usage/1000 Jan. 21 185.79 July. 68 621.55 Feb. 24 214.47 Aug. 74 675.06 Mar. 32 288.03 Sept. 62 562.03 Apr. 47 424.84 Oct. 50 452.93 May 50 454.58 Nov. 41 369.95 June 59 539.03 Dec. 30 273.93 Suppose that the monthly average temperature is 47 F. Calculate the fitted value of y and the corresponding residual. Test for significance of regression using α=0.01 (Use ANOVA). Calculate the r2 of the model. Find a 99% CI for .From the following data calculate Karl Pearson coefficient of skewness Wages (000’s) 270-280 280-290 290-300 300-310 310-320 320-330 330-340 340-350 workers 12 18 35 42 50 45 20 8
- The table below gives the population of a town (in thousands) from 2000 to 2008. What was the average rate of change of population between 2002 and 2004, and between 2002 and 2006? Year 2000 2001 2002 2003 2004 2005 2006 2007 2008 Population (thousands) 87 84 82 80 76 75 79 83 85 (a) between 2002 and 2004 __________people per year(b) between 2002 and 2006 __________people per yearThe table shows the U.S. population and the number of Americans over age 65 at 10-year intervals since 1940 (about when the Social Security program was created). YEAR 1940 1950 1960 1970 1980 1990 2000 2010 U.S. Population (millions) 132 151 179 203 227 249 281 309 Americans over age 65 (millions) 9.0 12.7 17.2 20.9 26.1 31.9 34.9 40.4 a) What is the percentage increase in the U.S. population between 1940 and 2010? b) What is the percentage increase in the over-65 population between 1940 and 2010? c) In 2010, there were approximately 165 million Americans of working age (25-65). Estimate (Assume ½ of this population is working), the number of people who were actually working and contributing to Social Security in 2010. Compare this number to the over-65 population. d) How do these results affect the future of programs such as Social Security and Medicare? PART 2 – Growth: Linear versus Exponential Lab 5. Based on information in Deep River Jim’s…The data table found below contains the listed prices and weights of the diamonds in 20 rings offered for sale in a newspaper in a foreign city. The prices are in local dollars with the weights in carats. Weight (carats) Price (dollars) 0.25 653 0.21 560 0.37 1,131 0.14 265 0.30 877 0.37 1,114 0.17 369 0.24 593 0.22 557 0.24 589 0.35 1,036 0.15 304 0.16 284 0.39 1,220 0.20 506 0.22 508 0.25 638 0.12 224 0.25 650 0.23 582 (a) What is the estimated difference in price (on average) between diamond rings with diamonds that…

