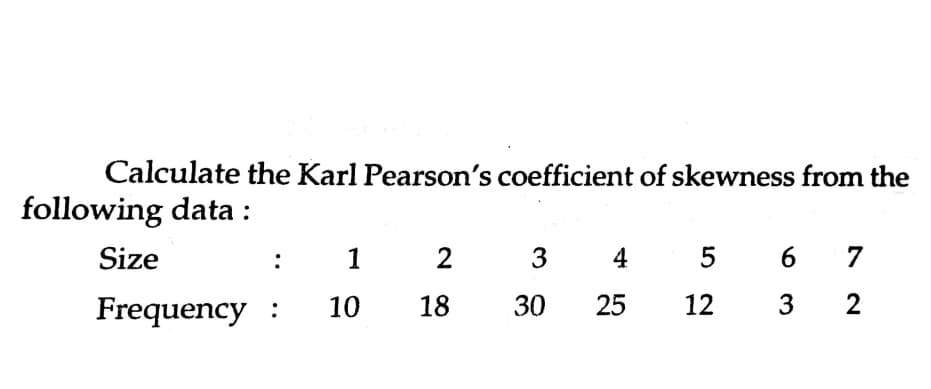
Calculate the Karl Pearson's coefficient of skewness from owing data : Size : 1 2 3 4 5 7 Frequency : 10 18 30 25 12 3


Q: A certain type of thread is manufactured wen a mean tensile strength of 75.3 klograms and a standard...
A: For a derived population with mean (i.e., the mean tensile strength) μ and standard deviation (i.e.,...
Q: A telemarketer calls individuals at home over the phone and ask them the likelihood that they will p...
A: A telemarketer calls individuals at home over the phone and asks them the likelihood that they will ...
Q: (c) Approximately what proportion of healthy children have left atrial diameters between 25 and 30 m...
A:
Q: Use the Central Limit Theorem to find the mean and standard error of the mean of the sampling distri...
A:
Q: Suppose that the distribution of typing speed in words per minute (wpm) for experienced typists usin...
A:
Q: The following table contains the ACT scores and the GPA (Grade point average) students. Grade point ...
A: Given Information: Student GPA ACT 1 2.8 21 2 3.4 24 3 3.0 26 4 3.5 27 5 3.6 29 6 3.0...
Q: Use Minitab to simulate 1000 rolls of five dice. Find the number of times that the sum of the Based ...
A: Note: Hi there! Thank you for posting the question. As you have posted multiple questions, as per th...
Q: You are conducting a study to see if the proportion of men over 50 who regularly have their prostate...
A:
Q: You wish to test the following claim (HaHa) at a significance level of α=0.10α=0.10. Ho:μ=65....
A:
Q: You wish to test the following claim (HaHa) at a significance level of α=0.10α=0.10. Ho:μ=82....
A:
Q: The pressure of wind in pounds per square foot, corresponding to the velocity in miles per hour has ...
A: Solution:
Q: The following are historical data on staff salaries (dollars per pupil) for 30 schools sampled in th...
A: Since you have posted multiple questions, as per our guidelines, we have provided answer for first t...
Q: (c) Interpret each of the probabilities in part (b) and explain the difference between them. (1) P(5...
A: Given that, a playlist on a music player consists of 100 songs, of which seven are by a particular a...
Q: A study was done to compare the amount of time per day students at public and private universities s...
A:
Q: Problem 1: Asking Embarrassing Questions, Politely When doing polling, for instance to figure out ho...
A: Given Information: Consider the experiment in which N people are asked whether or not they support a...
Q: Calculate the rank correlation coefficient for the following data: 39 65 62 90 82 75 25 98 36 78 y 4...
A:
Q: Let x denote the amount of gravel sold (in tons) during a randomly selected week at a particular sal...
A: For the given f(x ) Find (a) P (x> 1/4 ) = ? ( b ) P( X>=1/8 ) =>
Q: Suppose that fünd-raisers at a university call recent graduates to request donations för campus outr...
A:
Q: True or False. The probability of success for binomial distribution must remain the same for each ob...
A: According to the given information in this statement is not True
Q: A researcher records how much time each participant needs to solve a series of problems. This is an ...
A: Given : Example : A researcher records how much time each participant needs to solve a series of pro...
Q: what is the range? give the correct answer. a. 49 b. 48 c. 79 d. 31
A: Range = Largest observation - smallest observation Here largest observation = 79 Smallest observatio...
Q: Can you describe the normal curve and explain why the normal curve in real-life distributions will n...
A: Normal distribution: A normal distribution is the proper term for a probability bell curve. In a no...
Q: 1. (a) Suppose we have the simple linear model Yi = Bo + B1x; + ei, i = 1, ...,n, E[e;] = 0, var(e;)...
A: " Since you have posted a question with multiple sub-parts, we will solve the first three subparts f...
Q: Assume the random variable X is normally distributed with mean μ=50and standard deviation σ=7. Compu...
A:
Q: if the browns plant 3/16 tomatoes, 1/4 cabbage, and 2/8 peppers, what fraction of their garden will ...
A:
Q: Write a description and analysis of the data based on the resulting table/graph and computations don...
A: “Since you have posted a question with multiple sub-parts, we will solve first three subparts for yo...
Q: Calculate the test statistic
A: It is given that Sample size n = 58 Number of persons who would watch one of the television shows, X...
Q: In a certain school district, it was observed that 29% of the students in the element schools were c...
A:
Q: From the following data calculate Spearman's rank correlation coefficient where X and Y are the mark...
A: Given data is X 48 33 40 9 16 16 65 24 16 57 Y 13 13 24 6 15 4 20 9 13 19
Q: Determine the net price of an article listed at $590 less 37.5%, 12.5%, and 8⅓%
A: Given: Gross price=$590 Net price=Gross Price1+ Tax percentage
Q: You wish to test the following claim (HaHa) at a significance level of α=0.05α=0.05. Ho:μ=61....
A:
Q: Use the Minitab to simulate 10,000 rolls of two dice. Find the number of times that the sum of the t...
A: Given information: It is given that 2 dice should be rolled.
Q: Use Example B on pg 163 to solve the following problem. Find an expression to find an approximation ...
A: Please find the step by step explanation below. Thank you
Q: 6-S 8 - 10 10-12 Classes 2-4 4-6 1 Freq 3 6.
A: Given: classes Frequency 2-4 2 4-6 3 6-8 6 8-10 2 10-12 1
Q: 1 Declare variables of the appropriate data type for the following parameters • Number of cars in a ...
A: Number of cars in a parking lot- disrete variable price of items in a grocery shop - discrete varia...
Q: You wish to test the following claim (HaHa) at a significance level of α=0.005α=0.005.
A: Given, n = 45 96.1, 73.2, 51.7, 48.8, 90.5, 58, 72.3, 81.4, 72.7, 86.4, 84.6, 66.2, 68, 83, 78.1, 8...
Q: Find and share a link to an online research article whose study uses a p-value. First, identify the ...
A: P-value: In statistics, the p-value is the probability of obtaining results at least as extreme as t...
Q: A person drives for 200 kilometres at a speed of 30 k.p.h. He drives another 200 kilometres at a spe...
A: Solution is given:
Q: Given lo =90, perform a two-tailed t test with a 05 based on a sample ofN 4 scores with a mean of X ...
A: From the given information: hypothesized population mean (μ) = 90 Sample standard deviation (s) = 6....
Q: 6. The following data represent the ages of 15 people buying lift tickets at a ski area. 15 30 25 26...
A: The Interquartile range (IQR) for the age of given 15 observations is given as: IQR=Q3-Q1where, Q1=v...
Q: Inadequate exposure to outdoor lighting conditions may increase the risk of myopia in children. A st...
A:
Q: Let X be a random variable that can take three values: -1, 0 , 1, and let Mx(t) be the moment genera...
A:
Q: 7. A recent survey of 500 women indicated that 29% of women over age 55 in the study were widows. Co...
A: Givensample size(n)=500p^=29%=0.29confidence level=90%
Q: Which of the graphical techniques below can be used to summarize qualitative data? A) dot plot 9 ste...
A: which of the graphical techniques below can be used to summarize qualitative data ?
Q: a) The prime Minister of a small Caribbean Island stated that 95% of the population was vaccinated f...
A:
Q: described by the following Venn diagram A C O a. A - (B - C) O b. A - C O c (A - B) -C Od (A - c) - ...
A: We want to tell you which one is the correct choice.
Q: #6. The shape of the graph of a binomial distribution depends on the value of both n and p. To see h...
A: Shape of binomial depends on n and p n=20 (fixed) Binomial distribution: Shape of distribution:
Q: 2. Suppose that Y1~ exp(1) and Y2~exp(1). and Y1 + Y2. Y1+Y2 a. Determine the joint density of U and...
A: Solution
Q: A population with u = 85 and o = 12 is transformed into z-scores. After the transformation, the popu...
A:
Q: If you use α = .001, using p-value for X1, is the coefficient of X1 is significantly different fro...
A: Introduction: It is required to determine if the coefficient of the predictor X1 is significantly di...


Trending now
This is a popular solution!

Step by step
Solved in 2 steps

- for the following table, find first skewness coefficient.An analysis of production rejects resulted in the following figures: (attached) Calculate Karl Pearson’s coefficient of skewness and comment on the results.Calculate the coefficient of skewness from the data as follows. Hours No. of Tubes 300-400 14 400-500 46 500-600 58 600-700 76 700-800 68 800-900 62 900-1000 48 1000-1100 22 1100-1200 6
- The sample correlation coefficient is equal to the covariance of x and ydivided by the square root of the product of sx2 times sy2. True False1. Draw a scatterplot for these data and calculate the coefficients of determination.For a population with u=90 and o=20, a score of x=105 would correspond to a z-score of
- Calculate the z score where x = 15, µ = 1, and σ = 5For the given data calculate Skewness by Karl Pearson’s method Weight in kg 118-126 127-135 136-144 145-153 154-162 Number of items 2 6 10 4 3A survey among the workers in a large manufacturing company was taken, in order to findout from which company the workers had purchased their mobile phones, and to find outwhether the choice of mobile phone company was related to the type of worker. The resultsare shown in the table below. ls there evidence, at 5% level, that the choice of Phone Company is independent of the type ofworker?
