
Essentials Of Investments
11th Edition
ISBN:9781260013924
Author:Bodie, Zvi, Kane, Alex, MARCUS, Alan J.
Publisher:Bodie, Zvi, Kane, Alex, MARCUS, Alan J.
Chapter1: Investments: Background And Issues
Section: Chapter Questions
Problem 1PS

Related questions
Question
c. Calculate the profitability ratio which includes gross profit margin, operating profit margin, net profit margin, and NOPAT margin
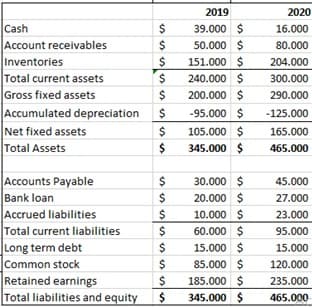
Transcribed Image Text:2019
2020
Cash
Account receivables
Inventories
Total current assets
Gross fixed assets
Accumulated depreciation
Net fixed assets
Total Assets
$
39.000 $
16.000
$
50.000 $
80.000
151.000 $
204.000
240.000 $
300.000
$
200.000 $
290.000
$
-95.000 $
-125.000
$
105.000 $
165.000
$
345.000 $
465.000
Accounts Payable
Bank loan
Accrued liabilities
Total current liabilities
Long term debt
30.000 $
45.000
$
20.000 $
27.000
$
10.000 $
23.000
60.000 $
15.000 $
95.000
15.000
Common stock
$
85.000 $
120.000
Retained earnings
Total liabilities and equity
185.000 $
235.000
$
345.000 $
465.000
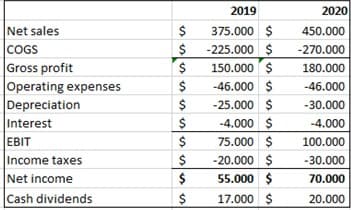
Transcribed Image Text:2019
2020
Net sales
COGS
Gross profit
Operating expenses
Depreciation
375.000 $
450.000
$
-225.000 $
-270.000
150.000 $
180.000
-46.000 $
-46.000
$
-25.000 $
-30.000
Interest
-4.000 $
-4.000
EBIT
75.000 $
100.000
Income taxes
-20.000 $
-30.000
Net income
$
55.000 $
70.000
Cash dividends
17.000 $
20.000
Expert Solution
This question has been solved!
Explore an expertly crafted, step-by-step solution for a thorough understanding of key concepts.

Step by step
Solved in 6 steps with 4 images

Knowledge Booster


Learn more about
Need a deep-dive on the concept behind this application? Look no further. Learn more about this topic, finance and related others by exploring similar questions and additional content below.Recommended textbooks for you
Essentials Of Investments
Finance
ISBN:
9781260013924
Author:
Bodie, Zvi, Kane, Alex, MARCUS, Alan J.
Publisher:
Mcgraw-hill Education,


Essentials Of Investments
Finance
ISBN:
9781260013924
Author:
Bodie, Zvi, Kane, Alex, MARCUS, Alan J.
Publisher:
Mcgraw-hill Education,

Foundations Of Finance
Finance
ISBN:
9780134897264
Author:
KEOWN, Arthur J., Martin, John D., PETTY, J. William
Publisher:
Pearson,

Fundamentals of Financial Management (MindTap Cou…
Finance
ISBN:
9781337395250
Author:
Eugene F. Brigham, Joel F. Houston
Publisher:
Cengage Learning

Corporate Finance (The Mcgraw-hill/Irwin Series i…
Finance
ISBN:
9780077861759
Author:
Stephen A. Ross Franco Modigliani Professor of Financial Economics Professor, Randolph W Westerfield Robert R. Dockson Deans Chair in Bus. Admin., Jeffrey Jaffe, Bradford D Jordan Professor
Publisher:
McGraw-Hill Education