Calculate the residual corresponding to the second observation. (Round your answer to two decimal places.) 7.16 x (e) Calculate a point estimate of o. (Round your answer to two decimal places.) 116.47 x Interpret the above point estimate of a.
Calculate the residual corresponding to the second observation. (Round your answer to two decimal places.) 7.16 x (e) Calculate a point estimate of o. (Round your answer to two decimal places.) 116.47 x Interpret the above point estimate of a.

Linear Algebra: A Modern Introduction
4th Edition
ISBN:9781285463247
Author:David Poole
Publisher:David Poole
Chapter7: Distance And Approximation
Section7.3: Least Squares Approximation
Problem 31EQ

Related questions
Question
please answer the wrong ones. box answer
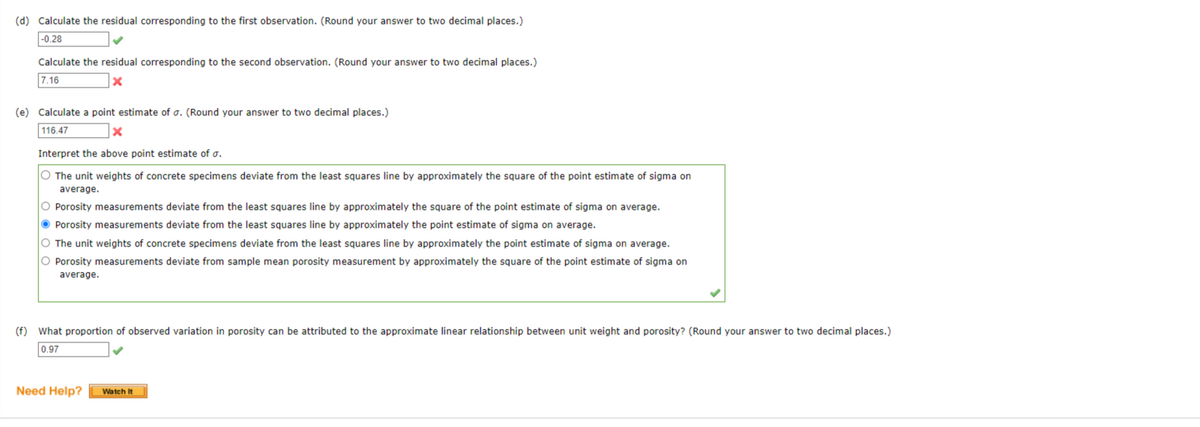
Transcribed Image Text:(d) Calculate the residual corresponding to the first observation. (Round your answer to two decimal places.)
-0.28
Calculate the residual corresponding to the second observation. (Round your answer to two decimal places.)
7.16
X
(e) Calculate a point estimate of o. (Round your answer to two decimal places.)
116.47
x
Interpret the above point estimate of a.
O The unit weights of concrete specimens deviate from the least squares line by approximately the square of the point estimate of sigma on
average.
O Porosity measurements deviate from the least squares line by approximately the square of the point estimate of sigma on average.
Porosity measurements deviate from the least squares line by approximately the point estimate of sigma on average.
O The unit weights of concrete specimens deviate from the least squares line by approximately the point estimate of sigma on average.
O Porosity measurements deviate from sample mean porosity measurement by approximately the square of the point estimate of sigma on
average.
(f) What proportion of observed variation in porosity can be attributed to the approximate linear relationship between unit weight and porosity? (Round your answer to two decimal places.)
0.97
Need Help? Watch It
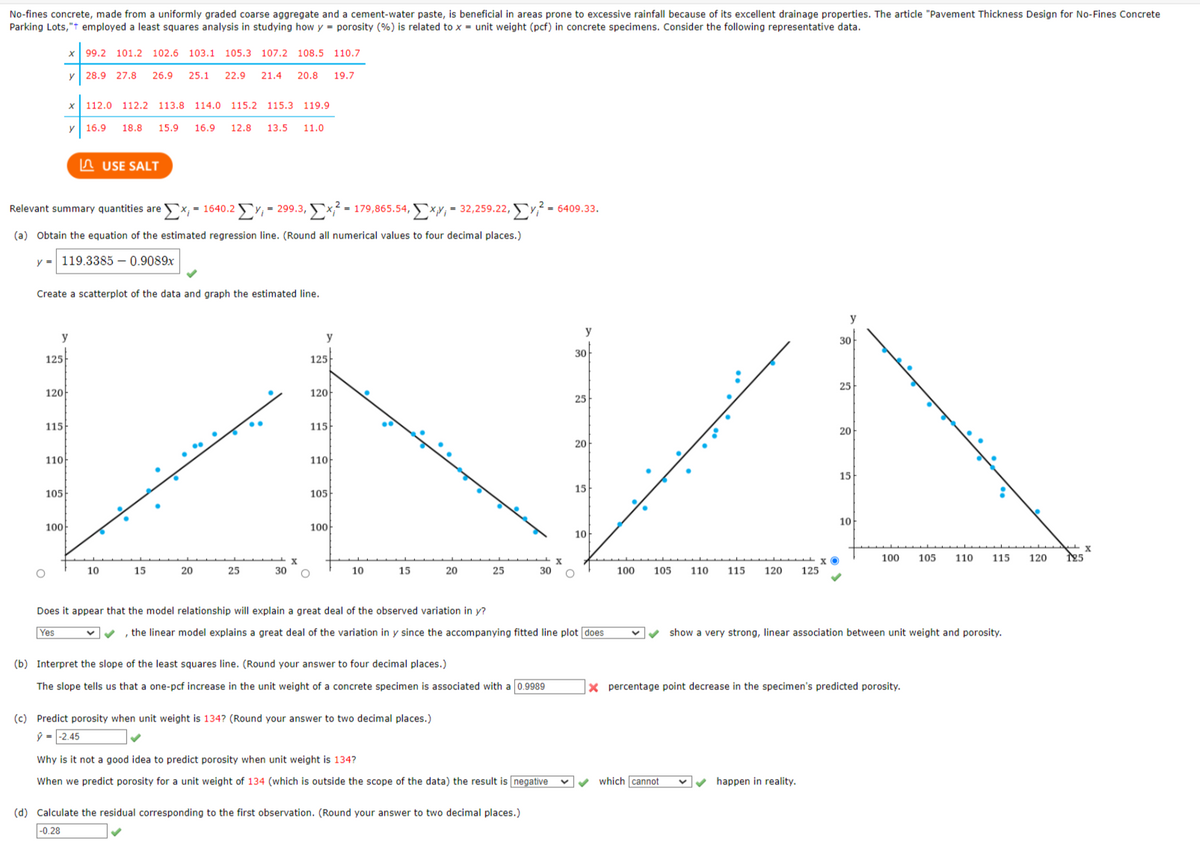
Transcribed Image Text:No-fines concrete, made from a uniformly graded coarse aggregate and a cement-water paste, is beneficial in areas prone to excessive rainfall because of its excellent drainage properties. The article "Pavement Thickness Design for No-Fines Concrete
Parking Lots,"+ employed a least squares analysis in studying how y porosity (%) is related to x unit weight (pcf) in concrete specimens. Consider the following representative data.
125
120
115
y
110
Relevant summary quantities are Σx, = 1640.2 ΣΥ, – 299.3, Σx2 – 179,865.54, Σxy, = 32,259,22, ΣΥ
(a) Obtain the equation of the estimated regression line. (Round all numerical values to four decimal places.)
y 119.3385 -0.9089x
105
y 28.9 27.8 26.9 25.1 22.9 21.4 20.8 19.7
Create a scatterplot of the data and graph the estimated line.
100
O
99.2 101.2 102.6 103.1 105.3 107.2 108.5 110.7
X 112.0 112.2 113.8. 114.0 115.2 115.3 119.9
y
16.9 18.8 15.9 16.9
USE SALT
10
12.8 13.5 11.0
15
20
25
30
X
y
125
120
115
110
105
100
10
15
20
Does it appear that the model relationship will explain a great deal of the observed variation in y?
Yes
25
(c) Predict porosity when unit weight is 134? (Round your answer to two decimal places.)
ŷ--2.45
(b) Interpret the slope of the least squares line. (Round your answer to four decimal places.)
The slope tells us that a one-pcf increase in the unit weight of a concrete specimen is associated with a 0.9989
-6409.33.
(d) Calculate the residual corresponding to the first observation. (Round your answer to two decimal places.)
-0.28
Why is it not a good idea to predict porosity when unit weight is 134?
When we predict porosity for a unit weight of 134 (which is outside the scope of the data) the result is [negative
y
30
25
20
30 O
, the linear model explains a great deal of the variation in y since the accompanying fitted line plot does
15
10
100
105
•
which cannot
110 115
120
125
✓✓happen in reality.
y
30
25
XO
20
15
10
100
Xpercentage point decrease in the specimen's predicted porosity.
105 110
show a very strong, linear association between unit weight and porosity.
115
120
125
Expert Solution
This question has been solved!
Explore an expertly crafted, step-by-step solution for a thorough understanding of key concepts.

Step by step
Solved in 3 steps

Recommended textbooks for you
Linear Algebra: A Modern Introduction
Algebra
ISBN:
9781285463247
Author:
David Poole
Publisher:
Cengage Learning
Linear Algebra: A Modern Introduction
Algebra
ISBN:
9781285463247
Author:
David Poole
Publisher:
Cengage Learning