Calculate the Standard Deviation and variance for the x-axis as shown in fig.1, showing your calcu 12,000- 10,000- 8,000- 6,000- 4,000- 2,000- 5 10 15 20 25 30
Calculate the Standard Deviation and variance for the x-axis as shown in fig.1, showing your calcu 12,000- 10,000- 8,000- 6,000- 4,000- 2,000- 5 10 15 20 25 30

Glencoe Algebra 1, Student Edition, 9780079039897, 0079039898, 2018
18th Edition
ISBN:9780079039897
Author:Carter
Publisher:Carter
Chapter10: Statistics
Section10.3: Measures Of Spread
Problem 23PFA

Related questions
Question
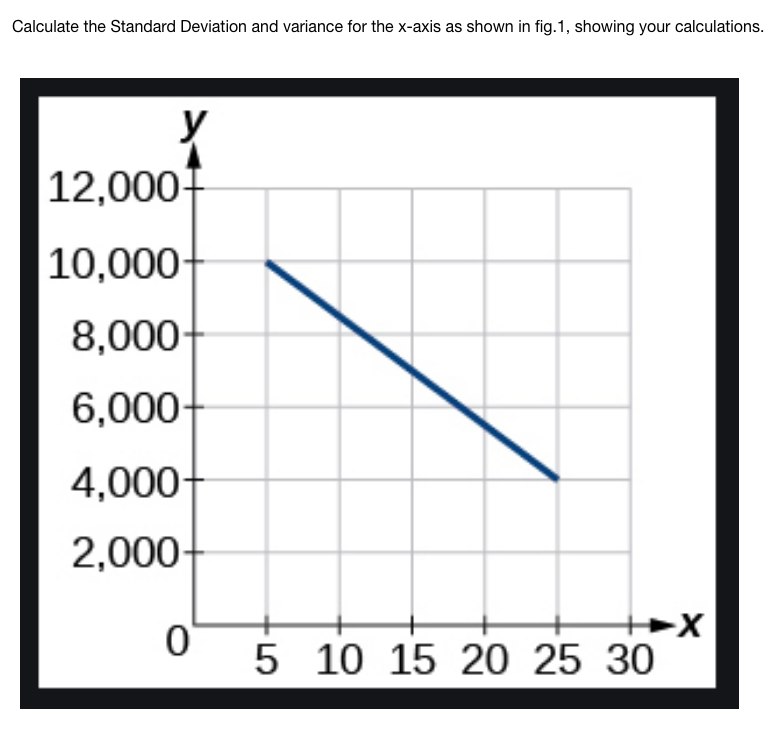
Transcribed Image Text:Calculate the Standard Deviation and variance for the x-axis as shown in fig.1, showing your calculations.
|12,000-
10,000-
8,000-
6,000-
4,000-
2,000-
5 10 15 20 25 30
Expert Solution
This question has been solved!
Explore an expertly crafted, step-by-step solution for a thorough understanding of key concepts.

Step by step
Solved in 4 steps

Recommended textbooks for you
Glencoe Algebra 1, Student Edition, 9780079039897…
Algebra
ISBN:
9780079039897
Author:
Carter
Publisher:
McGraw Hill
Glencoe Algebra 1, Student Edition, 9780079039897…
Algebra
ISBN:
9780079039897
Author:
Carter
Publisher:
McGraw Hill