Calculate the test​ statistic  Calculate the p value  What is the conclusion for this hypothesis​ test?   What is the fundamental error with this​ analysis?

Glencoe Algebra 1, Student Edition, 9780079039897, 0079039898, 2018
18th Edition
ISBN:9780079039897
Author:Carter
Publisher:Carter
Chapter10: Statistics
Section10.6: Summarizing Categorical Data
Problem 34PPS
icon
Related questions
Topic Video
Question

Calculate the test​ statistic 

Calculate the p value 

What is the conclusion for this hypothesis​ test?
 
What is the fundamental error with this​ analysis?
A police department released the numbers of calls for the different days of the week during the month of October, as shown in the table to the right. Use a 0.01
significance level to test the claim that the different days of the week have the same frequencies of police calls. What is the fundamental error with this analysis?
Day
Sun
Mon
Tues
Wed
Thurs
Fri
Sat
Frequency
157
201
225
249
174
205
239
Transcribed Image Text:A police department released the numbers of calls for the different days of the week during the month of October, as shown in the table to the right. Use a 0.01 significance level to test the claim that the different days of the week have the same frequencies of police calls. What is the fundamental error with this analysis? Day Sun Mon Tues Wed Thurs Fri Sat Frequency 157 201 225 249 174 205 239
Expert Solution
Step 1

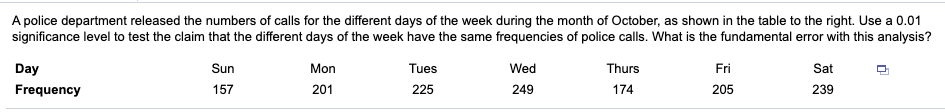
Let us first test whether “the different days of the week have the same frequencies of police calls”, using a Chi-square test of Goodness of fit.

Hypotheses:

The null hypothesis is:

H : the different days of the week have the same frequencies of police calls.

The alternative hypothesis is:

H : the different days of the week does not have the same frequencies of police calls.

Consider level of significance as 0.01.

Calculation steps:

The calculations have been done in EXCEL.

Denote Oi as the observed frequency (i =1, 2…7) and Ei as the expected frequency(i =1, 2…7). Here, the sample size, n=7.

The expected number of police calls for the day of the week is Ei=∑Oi/n. therefore, the value of the expected number of police calls will be (1,450)/7≈207.143.

Step 2

Test statistic:

The formula for the test statistic is χ2 = ∑ [(OiEi)2 / Ei], summed over all i .

The Table calculates [(OiEi)2 / Ei]for each (i). So, the value in the first cell will be (157– 207.143)2 /207.143 ≈ 1.6485.

The test statistic value can be calculated by adding all these cell values.

Day

Observed Frequency, Oi

Expected frequency, Ei

(Oi-Ei)2Ei

Sun

157

207.143

12.1381

Mon

201

207.143

0.1822

Tue

225

207.143

1.5394

Wed

249

207.143

8.4580

Thurs

174

207.143

5.3029

Fri

205

207.143

0.0222

Sat

239

207.143

4.8994

steps

Step by step

Solved in 3 steps

Blurred answer
Knowledge Booster
Hypothesis Tests and Confidence Intervals for Proportions
Learn more about
Need a deep-dive on the concept behind this application? Look no further. Learn more about this topic, statistics and related others by exploring similar questions and additional content below.
Recommended textbooks for you
Glencoe Algebra 1, Student Edition, 9780079039897…
Algebra
ISBN:
9780079039897
Author:
Carter
Publisher:
McGraw Hill