Calculate the values for the central line and the control limits for mean chart and then comment on the state of control.
Calculate the values for the central line and the control limits for mean chart and then comment on the state of control.

Glencoe Algebra 1, Student Edition, 9780079039897, 0079039898, 2018
18th Edition
ISBN:9780079039897
Author:Carter
Publisher:Carter
Chapter10: Statistics
Section10.4: Distributions Of Data
Problem 19PFA

Related questions
Question
100%
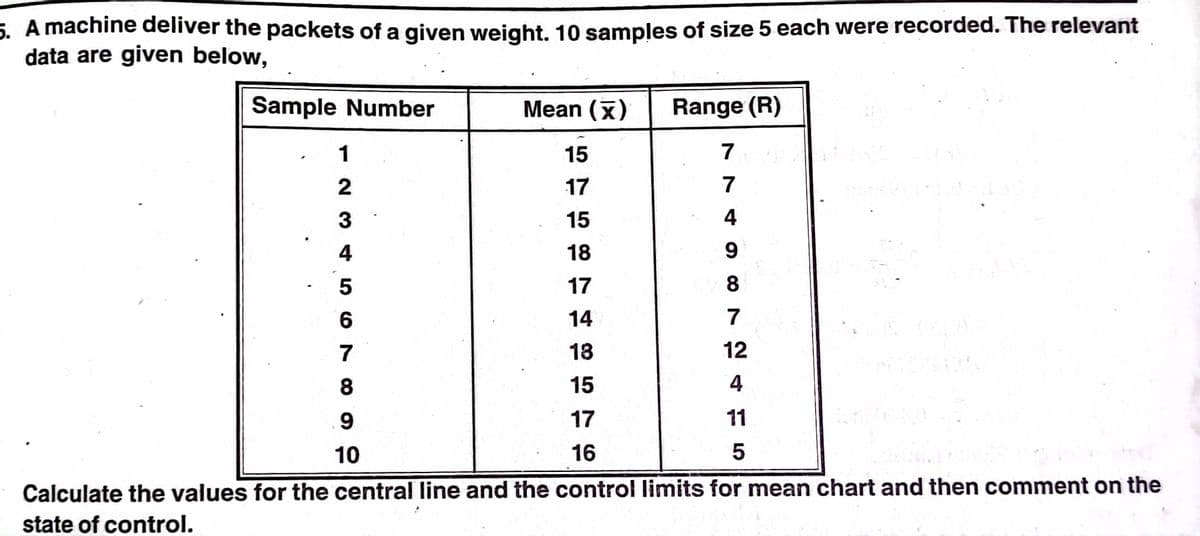
Transcribed Image Text:5. A machine deliver the packets of a given weight. 10 samples of size 5 each were recorded. The relevant
data are given below,
Sample Number
Mean (x)
Range (R)
1
15
7
2
17
7
3
15
4
4
18
9
5
17
8
14
7
7
18
12
8
15
4
17
11
10
16
Calculate the values for the central line and the control limits for mean chart and then comment on the
state of control.
Expert Solution
This question has been solved!
Explore an expertly crafted, step-by-step solution for a thorough understanding of key concepts.

Step by step
Solved in 2 steps with 2 images

Recommended textbooks for you
Glencoe Algebra 1, Student Edition, 9780079039897…
Algebra
ISBN:
9780079039897
Author:
Carter
Publisher:
McGraw Hill
Glencoe Algebra 1, Student Edition, 9780079039897…
Algebra
ISBN:
9780079039897
Author:
Carter
Publisher:
McGraw Hill