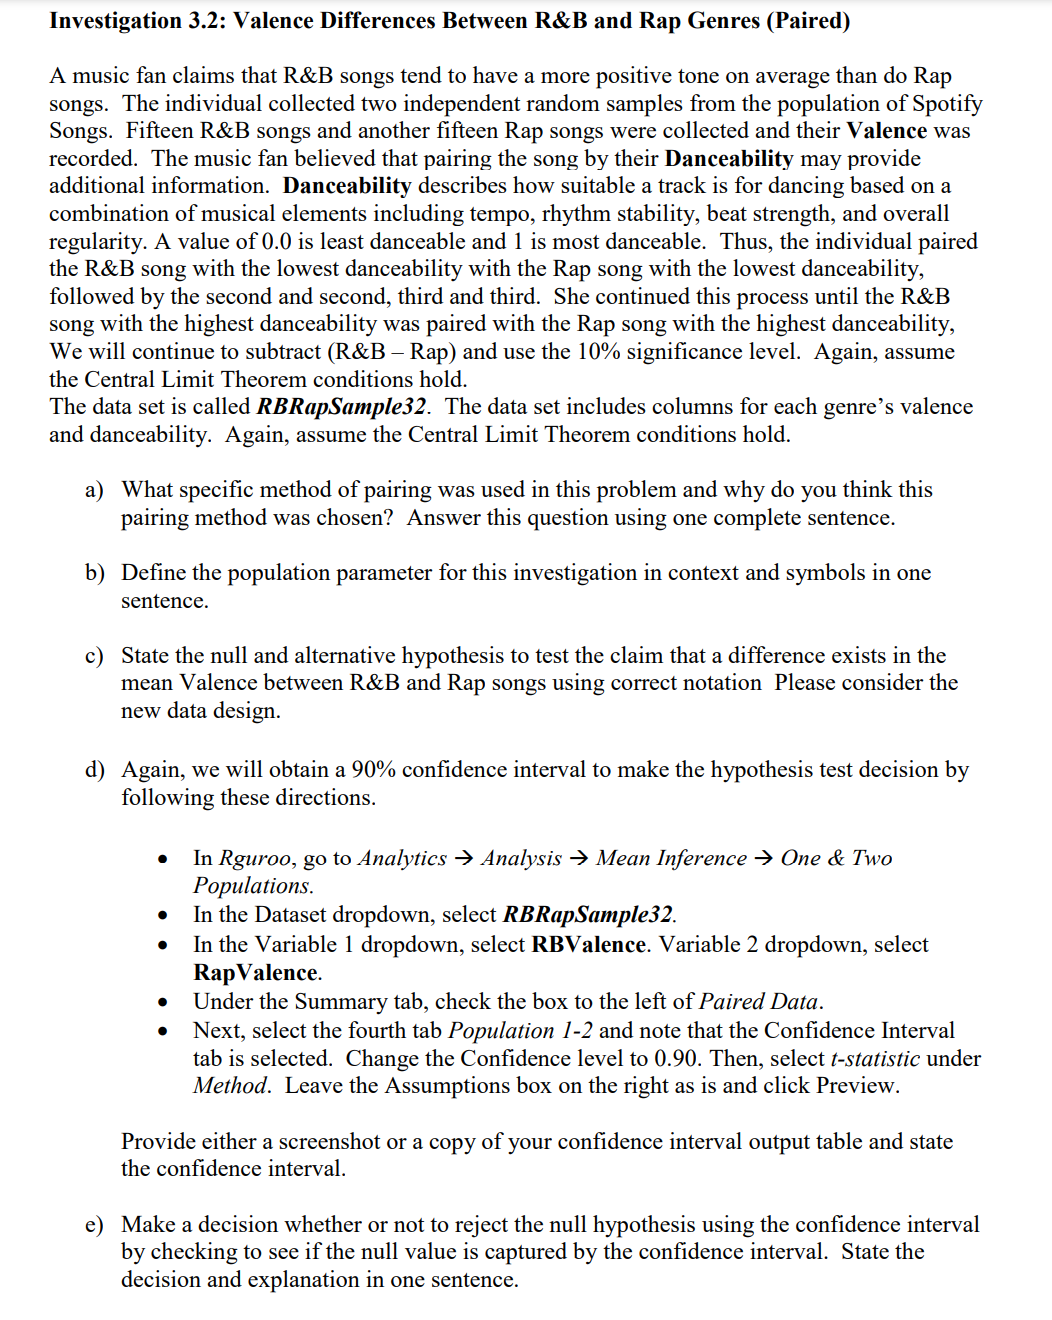
A music fan claims that R&B songs tend to have a more positive tone on average than do Rap songs. The individual collected two independent random samples from the population of Spotify Songs. Fifteen R&B songs and another fifteen Rap songs were collected and their Valence was recorded. The music fan believed that pairing the song by their Danceability may provide additional information. Danceability describes how suitable a track is for dancing based on a combination of musical elements including tempo, rhythm stability, beat strength, and overall regularity. A value of 0.0 is least danceable and 1 is most danceable. Thus, the individual paired the R&B song with the lowest danceability with the Rap song with the lowest danceability, followed by the second and second, third and third. She continued this process until the R&B song with the highest danceability was paired with the Rap song with the highest danceability, We will continue to subtract (R&B – Rap) and use the 10% significance level. Again, assume
A music fan claims that R&B songs tend to have a more positive tone on average than do Rap songs. The individual collected two independent random samples from the population of Spotify Songs. Fifteen R&B songs and another fifteen Rap songs were collected and their Valence was recorded. The music fan believed that pairing the song by their Danceability may provide additional information. Danceability describes how suitable a track is for dancing based on a combination of musical elements including tempo, rhythm stability, beat strength, and overall regularity. A value of 0.0 is least danceable and 1 is most danceable. Thus, the individual paired the R&B song with the lowest danceability with the Rap song with the lowest danceability, followed by the second and second, third and third. She continued this process until the R&B song with the highest danceability was paired with the Rap song with the highest danceability, We will continue to subtract (R&B – Rap) and use the 10% significance level. Again, assume

Glencoe Algebra 1, Student Edition, 9780079039897, 0079039898, 2018
18th Edition
ISBN:9780079039897
Author:Carter
Publisher:Carter
Chapter10: Statistics
Section10.6: Summarizing Categorical Data
Problem 10CYU

Related questions
Question
| RBValence | RapValence | RBDance | RapDance |
| 0.397 | 0.24 | 0.311 | 0.337 |
| 0.383 | 0.205 | 0.32 | 0.401 |
| 0.264 | 0.26 | 0.383 | 0.437 |
| 0.46 | 0.338 | 0.395 | 0.465 |
| 0.449 | 0.54 | 0.401 | 0.468 |
| 0.436 | 0.0371 | 0.407 | 0.482 |
| 0.516 | 0.217 | 0.521 | 0.487 |
| 0.381 | 0.499 | 0.548 | 0.506 |
| 0.53 | 0.577 | 0.594 | 0.547 |
| 0.631 | 0.684 | 0.635 | 0.552 |
| 0.714 | 0.78 | 0.706 | 0.57 |
| 0.799 | 0.463 | 0.72 | 0.598 |
| 0.64 | 0.547 | 0.727 | 0.778 |
| 0.902 | 0.826 | 0.866 | 0.884 |
| 0.845 | 0.847 | 0.896 | 0.906 |
Transcribed Image Text:Investigation 3.2: Valence Differences Between R&B and Rap Genres (Paired)
A music fan claims that R&B songs tend to have a more positive tone on average than do Rap
songs. The individual collected two independent random samples from the population of Spotify
Songs. Fifteen R&B songs and another fifteen Rap songs were collected and their Valence was
recorded. The music fan believed that pairing the song by their Danceability may provide
additional information. Danceability describes how suitable a track is for dancing based on a
combination of musical elements including tempo, rhythm stability, beat strength, and overall
regularity. A value of 0.0 is least danceable and 1 is most danceable. Thus, the individual paired
the R&B song with the lowest danceability with the Rap song with the lowest danceability,
followed by the second and second, third and third. She continued this process until the R&B
song with the highest danceability was paired with the Rap song with the highest danceability,
We will continue to subtract (R&B – Rap) and use the 10% significance level. Again, assume
the Central Limit Theorem conditions hold.
The data set is called RBRapSample32. The data set includes columns for each genre's valence
and danceability. Again, assume the Central Limit Theorem conditions hold.
a) What specific method of pairing was used in this problem and why do you think this
pairing method was chosen? Answer this question using one complete sentence.
b) Define the population parameter for this investigation in context and symbols in one
sentence.
c) State the null and alternative hypothesis to test the claim that a difference exists in the
mean Valence between R&B and Rap songs using correct notation Please consider the
new data design.
d) Again, we will obtain a 90% confidence interval to make the hypothesis test decision by
following these directions.
●
●
●
●
In Rguroo, go to Analytics → Analysis → Mean Inference → One & Two
Populations.
In the Dataset dropdown, select RBRapSample32.
In the Variable 1 dropdown, select RBValence. Variable 2 dropdown, select
Rap Valence.
Under the Summary tab, check the box to the left of Paired Data.
Next, select the fourth tab Population 1-2 and note that the Confidence Interval
tab is selected. Change the Confidence level to 0.90. Then, select t-statistic under
Method. Leave the Assumptions box on the right as is and click Preview.
Provide either a screenshot or a copy of your confidence interval output table and state
the confidence interval.
e) Make a decision whether or not to reject the null hypothesis using the confidence interval
by checking to see if the null value is captured by the confidence interval. State the
decision and explanation in one sentence.
Transcribed Image Text:f) Draw a conclusion about the claim using one or two sentences in context of the problem.
g) Verify your decision by obtaining a test statistic and p-value in Rguroo. Follow the
directions presented in part (d). Now, select the Test of Hypothesis tab. In this tab,
change the significance level to 0.10 and update the alternative hypothesis. Select t-
statistic under Method. Leave the Assumptions box on the right as is. Click Preview.
Provide either a screenshot or a copy of your hypothesis test output table and verify your
decision by comparing your p-value to the significance level in one complete sentence.
h) Compare the values of the standard errors calculated in 3.1(c) and 3.2(d). Why do you
believe these standard errors differ? Answer these questions in one or two sentences.
i) Can we generalize these results to a larger group (i.e. a population)? Answer this question
in one sentence and please provide a reason for your answer.
j) Can we determine if a cause and effect relationship exists between the variables? Answer
this question in one sentence and please provide a reason for your answer.
Expert Solution
This question has been solved!
Explore an expertly crafted, step-by-step solution for a thorough understanding of key concepts.

This is a popular solution!
Step 1: Given information:
VIEWStep 2: Identify the specific method of pairing:
VIEWStep 3: Define the population parameter:
VIEWStep 4: State the null and alternative Hypothesis:
VIEWStep 5: Identify the confidence interval
VIEWStep 6: Check whether the null hypothesis rejected or not:
VIEWStep 7: Conclusion:
VIEWSolution
VIEW
Trending now
This is a popular solution!

Step by step
Solved in 8 steps with 1 images

Follow-up Questions
Read through expert solutions to related follow-up questions below.
Follow-up Question
can a cause and effect relationship be determined?
Solution
Recommended textbooks for you
Glencoe Algebra 1, Student Edition, 9780079039897…
Algebra
ISBN:
9780079039897
Author:
Carter
Publisher:
McGraw Hill

Big Ideas Math A Bridge To Success Algebra 1: Stu…
Algebra
ISBN:
9781680331141
Author:
HOUGHTON MIFFLIN HARCOURT
Publisher:
Houghton Mifflin Harcourt
Glencoe Algebra 1, Student Edition, 9780079039897…
Algebra
ISBN:
9780079039897
Author:
Carter
Publisher:
McGraw Hill
Big Ideas Math A Bridge To Success Algebra 1: Stu…
Algebra
ISBN:
9781680331141
Author:
HOUGHTON MIFFLIN HARCOURT
Publisher:
Houghton Mifflin Harcourt