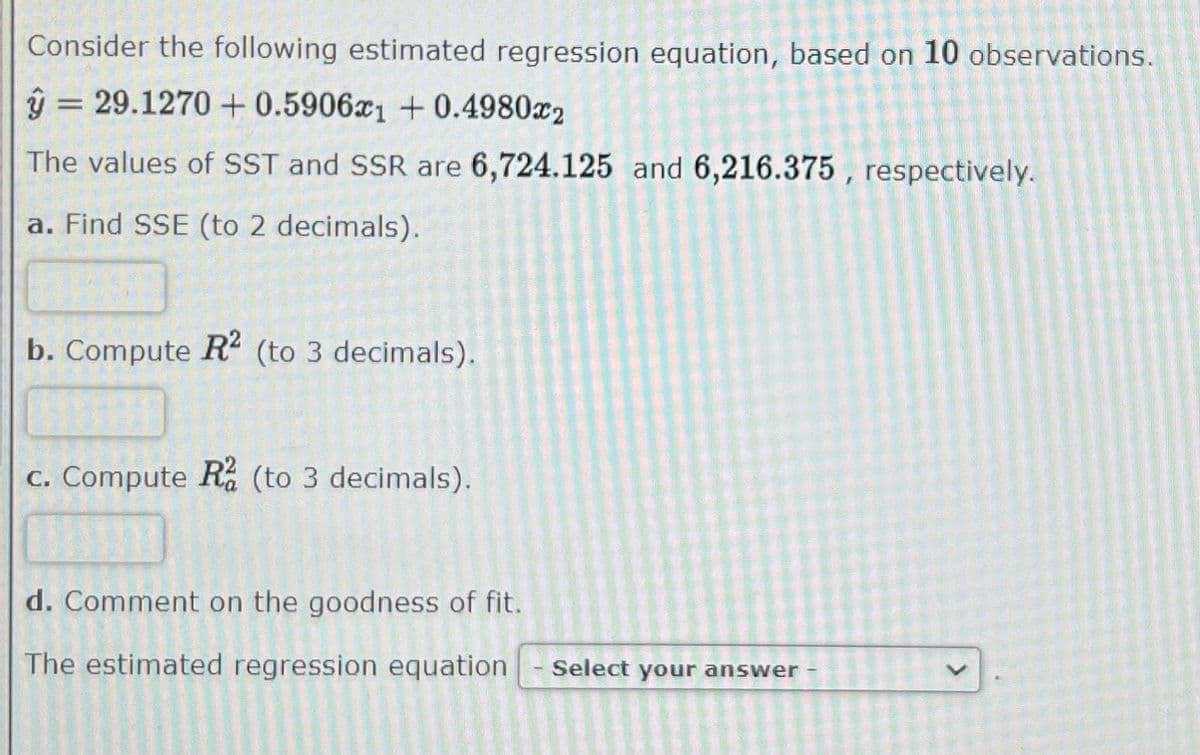
Consider the following estimated regression equation, based on 10 observations. 29.1270+ 0.5906x1 +0.4980x2 The values of SST and SSR are 6,724.125 and 6,216.375, respectively. a. Find SSE (to 2 decimals). b. Compute R2 (to 3 decimals). c. Compute Ra (to 3 decimals). d. Comment on the goodness of fit. The estimated regression equation Select your answer >


Q: Mean= Variance= B Standard Deviation= 19 20 21 Find the mean, variance, and standard deviation of…
A: Given that Probability distribution table x 19 20 21 22 23 P(x) 0.24 0.23 0.31 0.11 0.11…
Q: Suppose that X is a normally distributed with a mean 36 and standard deviation is 8 find the given…
A: normal distribution μ = 36σ = 8 P(x<35) = ?
Q: Factor B= 1 Factor B= 2 Factor A=1 (6.07,8.67, 0.48) (11.45,9.87, 11.43) Factor B= 3 (10.98, 12.07,…
A: A=1 A=2 A=3 A=4 B=1 6.07 0.72 9.13 16.54 8.67 -0.36 10.69 8.3 0.48 -3.61 17.16 17.07…
Q: lastly what sort of graph would be sutible for these data points.
A: To construct a t-test for each data set, we need to have two sets of data to compare. However, the…
Q: Construct the indicated confidence interval for the population mean u using the t-distribution.…
A: To construct the confidence interval, we can use the following formula: CI = x̄ ± tα/2 * (s/√n)…
Q: A single sample Z-test is to be done on a study about typhoons. Many believe that the average number…
A: As per our guidelines I can solve only first 3 subparts. Kindly post the remainder subparts again…
Q: Mein commute time in Atlanta, in minutes, using the data in CommuteAtlanta with n = 500, x bar=…
A: Sample size, n=500 Sample mean, x¯=29.11 Sample sd, s=20.72
Q: Find the margin of error for the given values of c,o and n C = 0.99, o = 522 and n= 36 Round to two…
A: Answer: From the given data, Sample size(n) = 36 Standard deviation(σ) = 522 Significance level(α) =…
Q: Historically, the percentage of residents of a certain country who support stricter gun control laws…
A: The percentage of residents of a certain country who support stricter gun control laws is 54%.…
Q: ss the original claim in symbolic form. =69.5 bpm an integer or a decimal. Do not round.) tify the…
A: Population mean μ =69.5 Sample size n =168 Sample mean=70.8
Q: Find the range for the given data set, 34,23,56,73,82,19,22,43,17,33
A: Answer: From the given data, 34,23,56,73,82,19,22,43,17,33 Sample size(n) = 10
Q: Listed below are the numbers of words spoken in a day by each member of eight different randomly…
A: From the provided information, Sample size (n) = 8 The difference (male - female) data is as follow:…
Q: When two births are randomly selected, the sample space for genders is bb, bg, gb, and gg. Assume…
A: 2 births are randomly chosen, hence, the possible births are b,b, b,g, g,b, g,g. Prob. of having a…
Q: The table above preformed Likelihood Ratio Tests comparing each model to the saturated model (ZXY).…
A: perform a likelihood ratio test to determine which model fits the data better comparing model…
Q: Q6- Answer correctly and read the question correctly, If the question is done correctly, I will…
A: Sample size, n=49 Population mean, μ=210 Sample mean, x¯=206 Sample standard deviation, s=14
Q: Find p^ and q^. Round your answers to three decimal places n= 43 and X= 19
A: Sample size n= 43 and favorable cases X= 19
Q: Here are the weights in ounces of a random sample of 25 oranges harvested at Sunny Day Orchards this…
A: We have given a random sample of 25 oranges harvested on sunny Day Orchards this season. We have to…
Q: Students estimated the length of one minute without reference to a watch or clock, and the times…
A: We have given data 67,80,40,64,42,23,61,63,67,49,66,70,95,90,64 We make the following table for the…
Q: the display provided from Statdisk. Use a 0.10 significance level. Click the icon to view the…
A: Sample size n =35 Population mean =8.953
Q: Suppose that this set of numbers are measurements from a normally distributed process. 42 22…
A: 42,22,36,17,19,54,27,32,13,22,13,18 sample size(n)=12 significance level(α )= 0.05
Q: How would you graph this?
A: Retail Price of Smart Phones in $ to know how to graph it.
Q: Babies Learn Early Who They Can Trust: A study indicates that babies may choose not to learn from…
A: The question is about hypo. testing Given : Total no. of reliable ( n1 ) = 30 No. of babies imitate…
Q: A researcher randomly purchases several different kits of a popular building toy. The following…
A: The question is about measures Given : To find : Mean of the data
Q: Answer the following questions: 3. Why do errors occur? 4. What are the implications of higher or…
A: Errors can occur due to various reasons such as data entry mistakes, faulty measurement tools,…
Q: 5. Assume that you plan to use a significance level of a = 0.05 to test the claim that p₁ = P2. Use…
A: It is of interest to test whether the two population proportions are equal.
Q: X 1.42 4.22 9.16 7.92 9.59 Y -0.31 8.86 26.03 21.68 27.96 Find estimates for the regression model yi…
A: Find estimates for the regression model yi Bo+ B₁xi + B2x+ε; where = N(0,02). Performing regression…
Q: The claim is that smokers have a mean cotinine level greater than the level of 2.84 ng/mL found for…
A: Test statistic(t)=56.931 sample size(n)=705 significance level(α)=0.10 Claim is that smokers have a…
Q: 7. Assume that you want to use a 0.05 significance level to test the claim that the paired sample…
A: The claim is that the paired sample data come from a population for which the mean difference is…
Q: 2) Type I and Type II Errors A tire manufacturer claims that their tires have an average lifetime of…
A: For the hypothesized claims H0:μ=50000 versus H1:μ≠50000, the critical region has been defined as:…
Q: In a random sample of eight cell phones, the mean full retail price was $507.00 and the standard…
A: Suppose µ is the population mean full retain price.
Q: c) Write down the contrasts (calculate by hand, or use the statistical package of your choice) and…
A: (i) Contrast for Mathematics-State A vs Mathematics-State B: H0:μMA=μMBH1:μMA≠μMB (ii) Contrast for…
Q: In the table below ratings data on x- the quality of the speed of execution and y-overall…
A: Speed Satisfaction 2.4 2.4 3.9 4 2.6 3 2.7 2.6 2.7 2.6 4 4 2.5 2.5 3.3 2.8 3 3…
Q: Major League Baseball now records information about every pitch thrown in every game of every…
A: The mean of the normal distribution, μ=92.12 mph The standard deviation of the normal distribution,…
Q: A data set includes weights (in grams) of 37 Reese's Peanut Butter Cup Miniatures. The accompanying…
A: claim : μ = 8.953n = 37α = 0.05we have to identify correct hypothesis.
Q: 109. Suppose a study was done to replicate the results of the 2003 study by Wansink et al. in…
A: Anova is the measure of a parametric test. It is used to compare the average significance of three…
Q: The table below shows the amounts of crude oil (in thousands of barrels per day) produced by a…
A: Obtain the 90% prediction interval for the amount of crude oil produced by the country is 5542…
Q: A data set about speed dating includes "like" ratings of male dates made by the female dates. The…
A: n = 196x¯ =7.56s = 1.84α = 0.05claim : μ < 8.00
Q: You are asked to determine whether laptop brand A charges a higher premium for its laptops than…
A: Here is the R-code to create a scatter plot of price vs. performance: This gives the following…
Q: The claim is that for 8 AM body temperatures of females, the mean is less than 98.6°F. The sample…
A: From the provided information, The hypotheses are as follow: H0: µ = 98.6 H1: µ < 98.6 Test…
Q: According to a report, 46% of home owners had a garden. How large a sample is required to estimate…
A: Answer: From the given data, P = 46% = 0.46 Margin of error (ME) = 8% = 0.08 98% confidence…
Q: You may need to use the appropriate appendix table or technology to answer this question.…
A: Company A Company B Sample size 71 52 Sample mean 44 39 Population standard deviation 11 12
Q: 109. Suppose a study was done to replicate the results of the 2003 study by Wansink et al. in…
A: Anova is the measure of a parametric test. It is used to compare the average significance of three…
Q: n a poll of 500 adults in July 2010, 270 of those polled said that schools should ban sugary snacks…
A: n= 500 Sample size x= 270 success p^=xn=270500=0.54 Sample proportion p= 0.50 Population…
Q: Identify whether this example has an internal validity problem. If it does, identify (i) whether the…
A: i. The study does not have an internal validity problem. ii. NA (no changes needed) Explanation: The…
Q: nterval then we accept the null hypothesis at a 5% significance level.
A: Population mean μ =0 Level of significance =0.05
Q: For the remaining statements, answer True or False and provide an explanation. If we draw two random…
A: If we draw two random samples from the same population and run the same regression on each sample,…
Q: Find the mean for the given data set, 24,11,32,16,18
A: Answer: From the given data set, 24,11,32,16,18 Sample size(n) = 5
Q: Critical region: Accepted region:
A: Here given normal curve that represents the critical value for hypothesis testing.
Q: Suppose that in a random selection of 100 colored candies, 27% of them are blue. The candy company…
A: Suppose that in a random selection of 100 colored candies, 27% of them are blue. The candy company…
Q: Determine whether the following value is a continuous random variable, discrete random variable, or…
A: Discrete variable: It is nothing but it takes or considers only the countable number of values or…
Plz solve all parts or leave it hanging
And in detail.


Trending now
This is a popular solution!

Step by step
Solved in 3 steps

- Find the equation of the regression line for the following data set. x 1 2 3 y 0 3 4The following fictitious table shows kryptonite price, in dollar per gram, t years after 2006. t= Years since 2006 0 1 2 3 4 5 6 7 8 9 10 K= Price 56 51 50 55 58 52 45 43 44 48 51 Make a quartic model of these data. Round the regression parameters to two decimal places.The following estimated regression equation is based on 30 observations. ŷ = 18.3 + 3.9x1 − 2.2x2 + 7.5x3 + 2.5x4 The values of SST and SSR are 1,805 and 1,762, respectively. a. Compute R2 = (to 3 decimals). b. Compute Ra2 = (to 3 decimals).
- The following estimated regression equation based on 30 observations was presented. ŷ = 17.6 + 3.8x1 − 2.3x2 + 7.6x3 + 2.7x4 The values of SST and SSR are 1,808 and 1,780, respectively. (a) Compute R2. (b) Compute Ra2. (c) Comment on the goodness of fit.The following estimated regression equation based on 10 observations was presented. ŷ = 29.1260 + 0.5306x1 + 0.4680x2 The values of SST and SSR are 6,728.125 and 6,215.375, respectively. (a) Find SSE. SSE = (b) Compute R2. (Round your answer to three decimal places.) R2 = (c) Compute Ra2. (Round your answer to three decimal places.) Ra2 = (d) Comment on the goodness of fit. (For purposes of this exercise, consider a proportion large if it is at least 0.55.) The estimated regression equation provided a good fit as a small proportion of the variability in y has been explained by the estimated regression equation.The estimated regression equation did not provide a good fit as a small proportion of the variability in y has been explained by the estimated regression equation. The estimated regression equation provided a good fit as a large proportion of the variability in y has been explained by the estimated regression equation.The following estimated regression equation based on 30 observations was presented. ŷ = 17.6 + 3.8x1 − 2.3x2 + 7.6x3 + 2.7x4 The values of SST and SSR are 1,807 and 1,757, respectively. (a) Compute R2. (Round your answer to three decimal places.) R2 = (b) Compute Ra2. (Round your answer to three decimal places.) Ra2 = (c) Comment on the goodness of fit. (For purposes of this exercise, consider a proportion large if it is at least 0.55.) The estimated regression equation did not provide a good fit as a large proportion of the variability in y has been explained by the estimated regression equation. The estimated regression equation provided a good fit as a large proportion of the variability in y has been explained by the estimated regression equation. The estimated regression equation provided a good fit as a small proportion of the variability in y has been explained by the estimated regression equation. The estimated regression equation did not provide a good…
- The following estimated regression equation based on 30 observations was presented. ŷ = 17.6 + 3.8x1 − 2.3x2 + 7.6x3 + 2.7x4 The values of SST and SSR are 1,801 and 1,758, respectively. (a)Compute R2. (Round your answer to three decimal places.) R2 = (b)Compute Ra2.(Round your answer to three decimal places.) Ra2 = (c) Comment on the goodness of fit. (For purposes of this exercise, consider a proportion large if it is at least 0.55.) The estimated regression equation provided a good fit as a small proportion of the variability in y has been explained by the estimated regression equation.The estimated regression equation did not provide a good fit as a large proportion of the variability in y has been explained by the estimated regression equation. The estimated regression equation did not provide a good fit as a small proportion of the variability in y has been explained by the estimated regression equation.The estimated regression equation provided a good fit as a…The following estimated regression equation based on 10 observations was presented. ŷ = 29.1670 + 0.5902x1 + 0.4960x2 Here, SST = 6,734.125, SSR = 6,212.375, sb1 = 0.0816, and sb2 = 0.0569. (a) Compute MSR and MSE. (Round your answers to three decimal places.) MSR=?? MSE=?? (b) Compute F and perform the appropriate F test. Use ? = 0.05. State the null and alternative hypotheses. H0: ?1 = ?2 = 0 Ha: One or more of the parameters is not equal to zero. H0: ?1 > ?2 Ha: ?1 ≤ ?2 H0: ?1 ≠ 0 and ?2 ≠ 0 Ha: One or more of the parameters is equal to zero. H0: ?1 < ?2 Ha: ?1 ≥ ?2 H0: ?1 ≠ 0 and ?2 = 0 Ha: ?1 = 0 and ?2 ≠ 0 Find the value of the test statistic. (Round your answer to two decimal places.) F = ?? Find the p-value. (Round your answer to three decimal places.) p-value = ?? State your conclusion. -Reject H0. There is sufficient evidence to conclude that the overall model is significant. -Do not reject H0.…Consider the following regression equation specied for 2-period panel data: where i = 1; 2; :::N and t = 1; 2. If you expect that β_1 is positive, but the correlation between Δx_i and Δu_i is negative, thenwhat is the bias in the OLS estimator of β_1 in the first-differenced equation?
- The following estimated regression equation is based on 30 observations. y=17.4 - 4.0x 1- 2.3x2 +7.3x32.9x4 The values of SST and SSR are 1,808 and 1,760, respectively. Compute R2 (to 3 decimals). Compute Ra2 (to 3 decimals). How good is the fit provided by the estimated regression equation?From the following data, determine if the data has a positive or a negative relationship with each other. Showcase the regression line, and determine if the data provided fits the approximate curve. Use the formula attached together with the given data.The following estimated regression equation based on 30 observations was presented. ŷ = 17.6 + 3.8x1 − 2.3x2 + 7.6x3 + 2.7x4 The values of SST and SSR are 1,801 and 1,758, respectively. (a) Compute R2. (Round your answer to three decimal places.) R2 = ?? (b) Compute Ra2. (Round your answer to three decimal places.) Ra2 = ?? (c)Comment on the goodness of fit. (For purposes of this exercise, consider a proportion large if it is at least 0.55.) -The estimated regression equation provided a good fit as a small proportion of the variability in y has been explained by the estimated regression equation. -The estimated regression equation did not provide a good fit as a large proportion of the variability in y has been explained by the estimated regression equation. -The estimated regression equation did not provide a good fit as a small proportion of the variability in y has been explained by the estimated regression equation. -The estimated regression equation…