can you help me fill out my balance sheets based on my journal.
Cornerstones of Financial Accounting
4th Edition
ISBN:9781337690881
Author:Jay Rich, Jeff Jones
Publisher:Jay Rich, Jeff Jones
Chapter12: Fainancial Statement Analysis
Section: Chapter Questions
Problem 97.1C
Related questions
Question
can you help me fill out my balance sheets based on my journal.

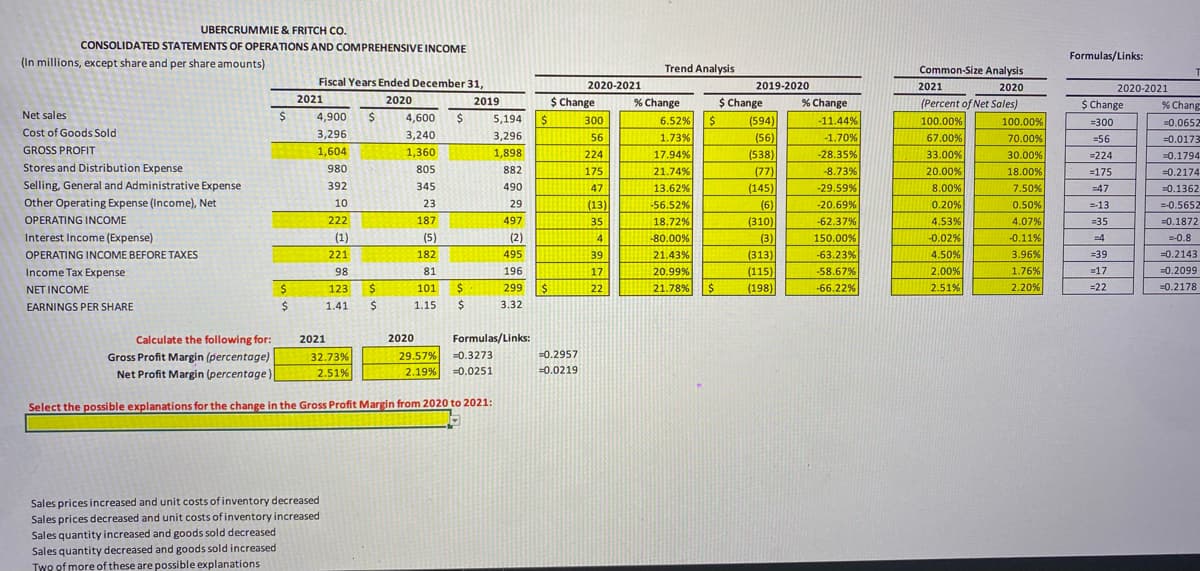
Transcribed Image Text:UBERCRUMMIE & FRITCH CO.
CONSOLIDATED STATEMENTS OF OPERATIONS AND COMPREHENSIVE INCOME
Formulas/Links:
(In millions, except share and per share amounts)
Trend Analysis
Common-Size Analysis
Fiscal Years Ended December 31,
2020-2021
2020-2021
$ Change
2019-2020
2021
2020
2021
2020
2019
$ Change
% Change
$ Change
% Change
(Percent of Net Sales)
% Chang
Net sales
4,900
4,600
$
6.52%
1.73%
17.94%
21.74%
5,194
300
(594)
-11.44%
100.00%
100.00%
=300
=0.0652
Cost of Goods Sold
3,296
3,240
67.00%
33.00%
3,296
56
(56)
-1.70%
70.00%
=56
=0.0173
GROSS PROFIT
1,604
1,360
1,898
224
(538)
-28.35%
30.00%
18.00%
7.50%
=224
=0.1794
Stores and Distribution Expense
980
805
882
175
(77)
-8.73%
20.00%
=175
=0.2174
Selling, General and Administrative Expense
392
345
490
47
13.62%
(145)
-29.59%
8.00%
=47
=0.1362
Other Operating Expense (Income), Net
10
23
29
(13)
-56.52%
(6)
-20.69%
0.20%
0.50%
=-13
=-0.5652
OPERATING INCOME
222
187
497
35
18.72%
(310)
-62.37%
4.53%
4.07%
=35
=0.1872
Interest Income (Expense)
(1)
(5)
(2)
4
-80.00%
(3)
(313)
150.00%
-0.02%
-0.11%
=4
=-0.8
OPERATING INCOME BEFORE TAXES
221
182
495
39
21.43%
-63.23%
4.50%
3.96%
=39
=0.2143
Income Tax Expense
98
81
196
17
20.99%
(115)
-58.67%
2.00%
1.76%
=17
=0.2099
NET INCOME
123
101
$4
299
$4
22
21.78%
(198)
-66.22%
2.51%
2.20%
=22
=0.2178
EARNINGS PER SHARE
$4
1.41
1.15
3.32
Calculate the following for:
2021
2020
Formulas/Links:
Gross Profit Margin (percentage)
32.73%
29.57%
=0.3273
=0.2957
Net Profit Margin (percentage
2.51%
2.19%
=0.0251
=0.0219
Select the possible explanations for the change in the Gross Profit Margin from 2020 to 2021:
Sales prices increased and unit costs of inventory decreased
Sales prices decreased and unit costs of inventory increased
Sales quantity increased and goods sold decreased
Sales quantity decreased and goods sold increased
Two of more of these are possible explanations

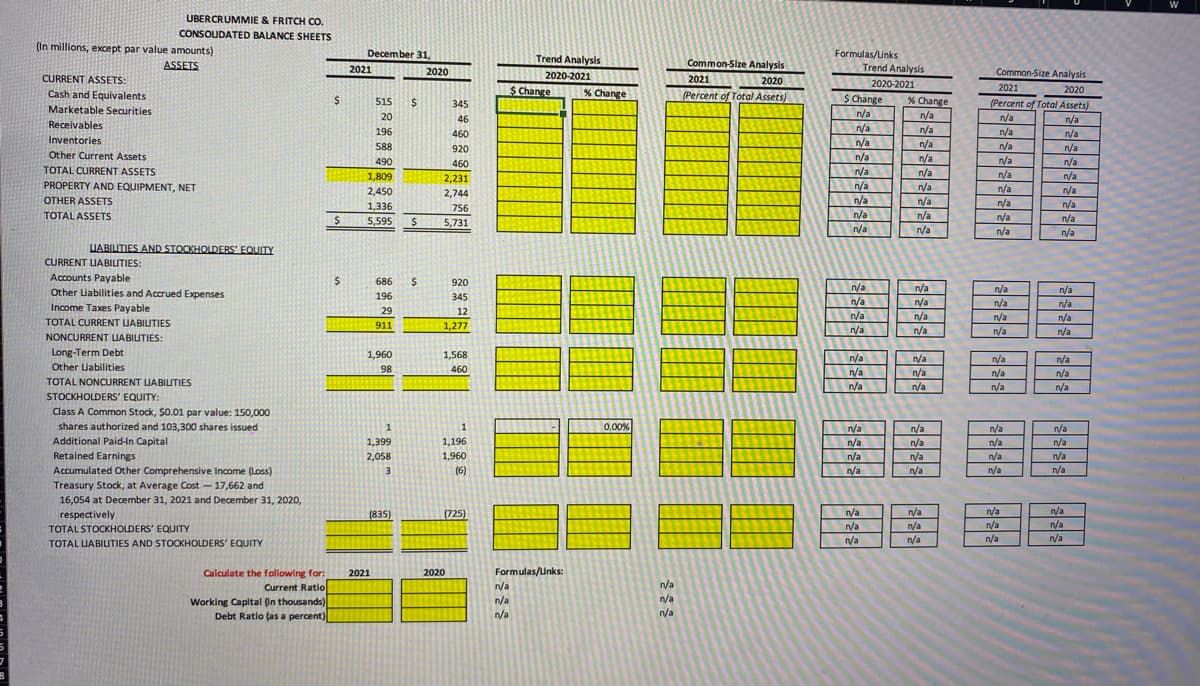
Transcribed Image Text:UBERCRUMMIE & FRITCH CO,
CONSOUDATED BALANCE SHEETS
(In millions, except par value amounts)
December 31,
Formulas/Links
Trend Analysis
2020-2021
S Change
n/a
ASSETS
Trend Analysis
Common-Size Analysis
2021
2020
2020-2021
Common-Size Analysis
CURRENT ASSETS:
2020
(Percent of Total Assets)
2021
$ Change
% Change
2021
2020
Cash and Equivalents
515
345
% Change
(Percent of Total Assets)
n/a
Marketable Securities
20
46
n/a
n/a
n/a
Receivables
196
n/a
n/a
n/a
460
Inventories
n/a
n/a
n/a
588
920
n/a
n/a
n/a
Other Current Assets
n/a
n/a
490
460
n/a
n/a
TOTAL CURRENT ASSETS
1,809
n/a
n/a
2,231
PROPERTY AND EQUIPMENT, NET
2,450
n/a
n/a
n/a
n/a
2,744
OTHER ASSETS
n/a
n/a
n/a
n/a
1,336
756
n/a
n/a
TOTAL ASSETS
n/a
n/a
n/a
5,595
5,731
n/a
n/a
UABIITIES AND STOCKHOLDERS' EQUITY
CURRENT LIABILITIES:
Accounts Payable
686
2$
920
n/a
n/a
n/a
n/a
Other Liabilities and Accrued Expenses
Income Taxes Payable
196
345
n/a
n/a
n/a
n/a
29
12
/a
n/a
n/a
n/a
n/a
TOTAL CURRENT UABIUTIES
911
1,277
/a
n/a
n/a
NONCURRENT UABILITIES:
Long-Term Debt
Other Liabilities
1,960
1,568
n/a
n/a
n/a
n/a
n/a
n/a
98
460
n/a
n/a
n/a
TOTAL NONCURRENT UABILITIES
n/a
n/a
n/a
STOCKHOLDERS' EQUITY:
Class A Common Stock, $0.01 par value: 150,000
shares authorized and 103,300 shares issued
1
0.00%
n/a
n/a
n/a
n/a
n/a
n/a
n/a
n/a
n/a
n/a
Additional Paid-In Capital
1,399
1,196
Retained Earnings
2,058
1,960
n/a
n/a
Accumulated Other Comprehensive Income (Loss)
(6)
n/a
n/a
n/a
n/a
Treasury Stock, at Average Cost – 17,662 and
16,054 at December 31, 2021 and December 31, 2020,
圈
n/a
n/a
/a
n/a
n/a
n/a
respectively
(835)
(725)
n/a
n/a
n/a
/a
TOTAL STOCKHOLDERS' EQUITY
n/a
n/a
TOTAL LIABIUTIES AND STOCKHOLDERS' EQUITY
Formulas/unks:
Calculate the following for:
Current Ratio
Working Capital (in thousands)
Debt Ratio (as a percent)
2021
2020
n/a
n/a
n/a
n/a
r/a
Expert Solution
Step 1
Balance sheet is one of the the financial statement of business which shows all assets, liabilities and equity of the business as on particular date. Ratio analysis is one of the management accounting technique which helps in decision making.
Trending now
This is a popular solution!
Step by step
Solved in 2 steps with 2 images

Knowledge Booster
Learn more about
Need a deep-dive on the concept behind this application? Look no further. Learn more about this topic, accounting and related others by exploring similar questions and additional content below.Recommended textbooks for you

Cornerstones of Financial Accounting
Accounting
ISBN:
9781337690881
Author:
Jay Rich, Jeff Jones
Publisher:
Cengage Learning

Survey of Accounting (Accounting I)
Accounting
ISBN:
9781305961883
Author:
Carl Warren
Publisher:
Cengage Learning

Financial Accounting: The Impact on Decision Make…
Accounting
ISBN:
9781305654174
Author:
Gary A. Porter, Curtis L. Norton
Publisher:
Cengage Learning

Cornerstones of Financial Accounting
Accounting
ISBN:
9781337690881
Author:
Jay Rich, Jeff Jones
Publisher:
Cengage Learning

Survey of Accounting (Accounting I)
Accounting
ISBN:
9781305961883
Author:
Carl Warren
Publisher:
Cengage Learning

Financial Accounting: The Impact on Decision Make…
Accounting
ISBN:
9781305654174
Author:
Gary A. Porter, Curtis L. Norton
Publisher:
Cengage Learning


Managerial Accounting
Accounting
ISBN:
9781337912020
Author:
Carl Warren, Ph.d. Cma William B. Tayler
Publisher:
South-Western College Pub

Financial Accounting
Accounting
ISBN:
9781337272124
Author:
Carl Warren, James M. Reeve, Jonathan Duchac
Publisher:
Cengage Learning