Can you please help me interpret this data?

Chapter8: Sequences, Series,and Probability
Section8.7: Probability
Problem 4ECP: Show that the probability of drawing a club at random from a standard deck of 52 playing cards is...

Related questions
Question
Can you please help me interpret this data?
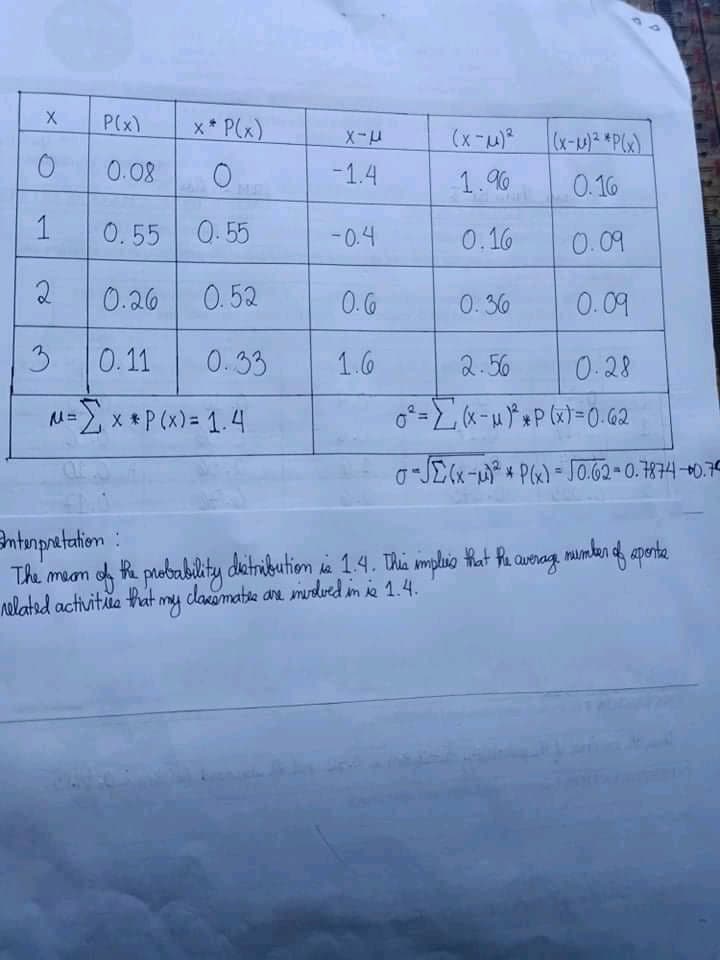
Transcribed Image Text:X.
P(x)
x* P(x)
0.08
-1.4
1.%
0.16
0.55
0.55
-0.4
0.16
0.09
2
0.26
0.52
0.G
0.36
0.09
3
0.11
0.33
1.6
2.56
0.28
0-JE(x- * P(x) = J0.62-0.874 +0.70
Bntumpratation:
of te probability detribution ie 14. Thi mplio that Re auerag maumban of aporte
nelated activitia Pat my daromatie are murdved in ie 1.4.
The meam
1.
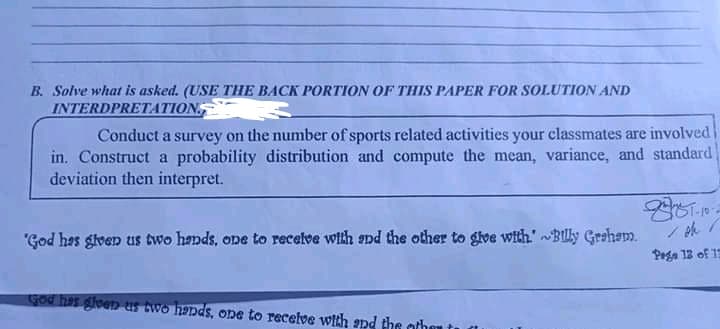
Transcribed Image Text:B. Solve what is asked. (USE THE BACK PORTION OF THIS PAPER FOR SOLUTION AND
INTERDPRETATION,
Conduct a survey on the number of sports related activities your classmates are involved
in. Construct a probability distribution and compute the mean, variance, and standard
deviation then interpret.
/小/
"God has glven us two hands, one to recelve with and the other to glve with."Blly Grsham.
Pega 12 of 13
God hes gleen us two hands, one to receive wich snd the other
Expert Solution
This question has been solved!
Explore an expertly crafted, step-by-step solution for a thorough understanding of key concepts.

Step by step
Solved in 2 steps

Recommended textbooks for you

Holt Mcdougal Larson Pre-algebra: Student Edition…
Algebra
ISBN:
9780547587776
Author:
HOLT MCDOUGAL
Publisher:
HOLT MCDOUGAL
Holt Mcdougal Larson Pre-algebra: Student Edition…
Algebra
ISBN:
9780547587776
Author:
HOLT MCDOUGAL
Publisher:
HOLT MCDOUGAL