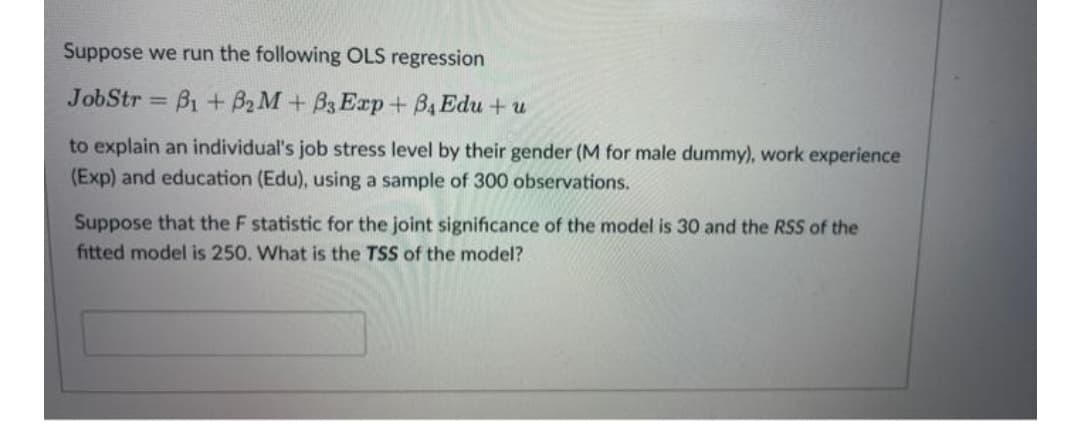
What is the TSS of the model?


Q: South Africa's economy posted 15 consecutive years of growth between the end of apartheid and the…
A: Given Information: No. of graphs=021st graph=GDP growth rate2nd graph=Unemployment rate
Q: Which of the following events is equally likely to happen? The event with a probability of 0.8. O…
A: Which of the following events is equally likely to happen?
Q: Use the figure to the right, which shows the percentages of adults from several countries who favor…
A: Decision rule using p-value : 1) Reject null hypothesis (H0) if p-value less than significance…
Q: A magazine provided results from a poll of 1000 adults who were asked to identify their favorite…
A: Given that Total number of adults (n) = 1000 Adults chosen chocolate pie (p) = 14% = 0.14 We know…
Q: Identify the type of correlation from the graph. 12- 10 0 . 2 6 Positive correlation Negative…
A: Solution-: We identify the type of correlation from the given graph:
Q: Heller Manufacturing has two production facilities that manufacture baseball gloves. Production…
A:
Q: a certain population, the height of women (X) is normally distributed with mean 64 and standard…
A:
Q: The number of stories in each of a sample of the world’s 20 tallest buildings follows. Construct a…
A: Given data is 55 80 70 79 54 56 78 77 64 60 71…
Q: Test the claim that the mean GPA of night students is larger than 3.2 at the 0.025 significance…
A: Consider that μ is the mean GPA of all night students.
Q: Two variables are found to have a strong positive linear correlation. Pick the correct statement. An…
A: Given that Last option is the correct choice An increase in one variable causes an increase in the…
Q: 10. Which of the following statistics describes the spread of a sample? A. Size, n B. Mean, x C.…
A:
Q: Draw the scatter plot for the following data: x 100 200 300 400 500 5 25 45 65 85
A: Given data is x 100 200 300 400 500 y 5 25 45 65 85
Q: Questions 11-15 are about this data, taken from a sample: {0, 0, 1, 4, 5} 11. What is the mean of…
A: Givensample:{0,0,1,4,5}
Q: Q18. If x ~ N(100, 25) and a random sample of x of size 16 is obtained. What is the standard…
A:
Q: eart attack or stroke within one year, and of the ticagrelor patients, 565 suffered a heart attack…
A:
Q: ACTIVITY. From the table below, determine the relationship between number of Facebook friends and…
A: Given information: X Y X^2 Y^2 XY 3889 239 15124321 57121 929471 4999 576 24990001 331776…
Q: calorie level was 192 and the sample standard deviation was 8. Does this data suggest that the true…
A: Here n=54 x=192s=88
Q: 1. Use last digit of your student ID(I called it b) to do the following problem. Charges for…
A:
Q: 6. Due to a manufacturing error, three cans of regular soda were accidentally filled with diet soda…
A: Given that - Due to a manufacturing error, three cans of regular soda were accidentally filled with…
Q: Which of the following is an example of an experiment of equally likely events? A.Tossing a coin…
A: An outcomes is said to be equally likely if they have an equal chance of occurring
Q: What is the mean of the following data set 60,52,48,32,62,45,48,52,60,48
A: Solution
Q: A company estimates that 0.7% of their products will fail after the original warranty period but…
A:
Q: In a normal distribution approximately what percent of data items fall within 1Standard deviation of…
A: Data fall within one standard deviation
Q: rm on x'+y' 0. Find
A: It is given that X, Y, are uniform on, x2+y2<1, y>1.
Q: Q18. If x~N(100, 25) and a random sample of x of size 16 is obtained. What is the standard deviation…
A:
Q: Find the type of correlation from the graph. Positive correlation O Negative correlation No…
A: Identify the type of correlation exists in the graph. The type of correlation exists in the graph…
Q: Can we consider the data to be normally distributed? Explain. Calculate the sample mean and…
A: Yes we consider the data to be normally distributed Because if the data follows normal distribution…
Q: 2.1. Find the likelihood function L(0) and if needed the density function of the MLE. 2.2. Formulate…
A:
Q: The table illustrates the cost of objects in a stationary shop. Quantity 2 4 6 Cost 6 12 18…
A: From the above data. The correct option is Yes, Causation is there
Q: Use the following contingency table to complete (a) and (b) below. A B C Total 1…
A: Part 1: A B C 1 20.625 31.875 37.5 2 34.375 53.125 62.5 Part 2: A.H0:πA=πB=πC H1:Not…
Q: The following items represent the number of birds observed at a given feeder over the past several…
A: Arranging ins descending order 2,19,33,35,48,68,74
Q: Teduh 6. After three exams, Jenny has a mean score of 74. With only one exam remaining in the class,…
A:
Q: QUESTION 1 Numerically calculate the marginal effect of an increase in X at point X = 3 in the…
A:
Q: A manager wishes to determine the relationship between the number of years the manager's sales…
A: Given information: x y x^2 y^2 XY 6 21 36 441 126 7 23 49 529 161 14 68 196 4624 952 11…
Q: 20. Below is an actual bar graph displayed on CNN during the Terri Schiavo controversy. The graph…
A:
Q: Among 70 exposed people. 15 developed disease and 55 remained healthy. What is the odds of illness…
A: Given: developed disease = 15remained healthy = 55Total exposed = 70
Q: A graduate Statistic Student wants to estimate the true proportion of county college ( "c.c.")…
A: It is given that x is 64 and n is 100.
Q: A population of values has a normal distribution with μ=201.4 and σ=41.3 You intend to draw a random…
A: A population of values has a normal distribution with μ=201.4 and σ=41.3 n=77
Q: Studies have shown that stress and consumption of a poor diet can impact learning and memory. I want…
A: (1) Determine the number of null hypotheses. The number of null hypotheses are determined below…
Q: Hypothesis Testing: Z-Distribution According to an NDP Group report, the mean number of meals…
A: a) The hypotheses for the test are given below. Null hypothesis: H0: µ =700 Alternative hypothesis:…
Q: Use the figure to the right, which shows the percentages of adults from several countries who favor…
A:
Q: You are a vendor selling programs in front of the stadium of a certain pro football team that has…
A:
Q: 6. How can the z-score of a data point be described in words? A. The Z-score is the number of…
A: It is also known as standard normal variable
Q: During the 2010 MLB seasons, the home team won 1,269 games and the away team won 1,371 games. What…
A: Solution-: Given: x=1269, n=1269+1371=2640 and P0=0.50 We want to find test statistic=?
Q: onsider a scenario where a Type I error is more severe than a Type II error. Pick the most…
A: Given that Based on the given scenario
Q: Based on the data shown below, calculate the regression line (each value to at least two decimal…
A: Given data, X Y X*Y X*X 2 40.26 80.52 4 3 39.47 118.41 9 4 37.88 151.52 16 5 36.09…
Q: Which cell contributes most to the chi-square statistic? Americans in the United States who…
A: The output shows the cell counts, the expected cell counts and the chi-square stateistc.
Q: An experiment was conducted to investigate the effects of the concentrations of sulfuric acid…
A:
Q: In an experiment to investigate the performance of four different brands of spark plugs intended for…
A: Sum of squares for Error: Mean squares Error=Sum of squaresdf 14671.13=Sum of…
Q: Draw the scatter plot for the following data: X 5 10 15 Y 20 40 60 20 80 25 100
A:
5

Step by step
Solved in 2 steps with 3 images

- One day in gym class students took a physical fitness test bydoing push-ups and sit-ups. The standard deviation of the number of sit-ups they were able to do was 7 and the stand-ard deviation of the number of push-ups was 2. A Statistics student used these data to create a least squares regressionline to predict the number of sit-ups a student was able to dobased on the number of push-ups the student did. Which ofthe following could NOT be the slope of that line?A) -2 B) -0.5 C) 1D) 3 E) 4Given the estimated least square regression line y=2.48+1.63x, and the coefficient of determination of 0.81, What is the value of correlation coefficient?In reading the results of a multiple regression analysis that contained 4 predictor variables, the researcher noticed a column labeled Beta. Two of the Beta’s were positive and two were negative. He concluded that a.) Beta’s that were positive were statistically significant b.) Beta’s that were positive had more of an effect c.) Beta’s that were positive were associated with increases in the criterion variable d.) Beta’s that were positive did not affect the criterion because they were “controlled for…”
- Years of Work Experience and number of Job Offers of 10 job-seekers were as follows: Work Exp. 4 2 5 3 7 12 2 5 4 9 No. of Offers 7 1 8 4 13 19 3 11 9 15 a. Fit the regression equation of No. of Job Offers on Years of Work Experience. b. What will be the predicted number of offers for an applicant with 6 years of experience? c. Verify the relationship between the number of job offers and years of work experience using at least two relevant methodsThe y-interept bo of a least-squares regression line has a useful interpretation only if the x-values are either all positive or all negative. Determine if the statement is true or false. Why? If the statement is false, rewrite as a true statement.Suppose the following data were collected from a sample of 15 houses relating selling price to square footage and the architectural style of the house. Use statistical software to find the following regression equation: PRICEi=b0+b1SQFTi+b2COLONIALi+b3RANCHi+ei . Is there enough evidence to support the claim that on average, houses that are ranch style have lower selling prices than houses that are Victorian style at the 0.05 level of significance? If yes, write the regression equation in the spaces provided with answers rounded to two decimal places. Else, select "There is not enough evidence."Selling Price Square Footage Colonial (1 if house is Colonial style, 0 otherwise) Ranch (1 if house is Ranch style, 0 otherwise) Victorian (1 if house is Victorian style, 0 otherwise) 377640 1941 1 0 0 460996 3397 0 1 0 405781 2764 0 0 1 407216 2906 0 0 1 435139 3401 1 0 0 405275 2600 0 0 1 381141 2203 0 1 0 370490 2046 1 0 0 404070 2210 0 0 1 460196 3692 0 1 0 382780 2172 1 0 0 406466 2606 0 1…
- The Wall Street Journal asked Concur Technologies, Inc., an expense management company, to examine data from 8.3 million expense reports to provide insights regarding business travel expenses. Their analysis of the data showed that New York was the most expensive city. The following table shows the average daily hotel room rate (X) and the average amount spent on entertainment (Y) for a random sample of 9 of the 25 most-visited U.S. cities. These data lead to the estimated regression equation y = 17.49 + 1.0334x. For these data SSE = 1541.4. Use Table 1 of Appendix B. a. Predict the amount spent on entertainment for a particular city that has a daily room rate of $89 (to 2 decimals). b. Develop a 95% confidence interval for the mean amount spent on entertainment for all cities that have a daily room rate of $89 (to 2 decimals). c. The average room rate in Chicago is $128. Develop a 95% prediction interval for the amount spent on entertainment in Chicago (to 2 decimals).The Wall Street Journal asked Concur Technologies, Inc., an expense management company, to examine data from 8.3 million expense reports to provide insights regarding business travel expenses. Their analysis of the data showed that New York was the most expensive city. The following table shows the average daily hotel room rate (X) and the average amount spent on entertainment (Y) for a random sample of 9 of the 25 most-visited U.S. cities. These data lead to the estimated regression equation y = 17.49 + 1.0334x. For these data SSE = 1541.4. Use Table 1 of Appendix B. (NEED ANSWER FOR A) a. Predict the amount spent on entertainment for a particular city that has a daily room rate of $89 (to 2 decimals).If all the points in a scatter diagram lie on the least squares regression line, what must be the coefficient of correlation equal to
- A study is conducted to determine if there is a relationship between the two variables, blood haemoglobin (Hb) levels and packed cell volumes (PCV) in the female population. A simple linear regression analysis was performed using SPSS. Based on the SPSS output of the ANOVA table, which of the following statements is the CORRECT interpretation? 1. The regression model statistically significantly predicts the blood haemoglobin level. 2. About 39.98 % of variance in Hb is explained by PCV. 3. The regression model does not fit the data. 4. There is significant contribution of Hb towards PCV.The director of an obesity clinic in a large northwestern city believes that drinking soft drinks contribute to obesity in children. To determine whether a relationship exists between these two variables, she conducts the following pilot study. Eight- 12-year-old male volunteers are randomly selected from children attending a local junior high school. Parents of the children are asked to monitor the number of soft drinks consumed by their child over a one week period. The children are weighed at the end of the week and their weights converted into body mass index (BMI) values. The BMI is a common index used to measure obesity and takes into account both height and weight. An individual is considered obese if they have a BMI value 30. The following data or collected: child. # of soft drinks consumed BMI 1 3 20 2 1 18 3…In Australia, 16% of the adult population is nearsighted.17 If three Australians are chosen at random, what is the probability that two are nearsighted and one is not? 2.state each of the five assumptions of the classical regression model (OLS) and give an intuitive explanation of the meaning and need for each of them.