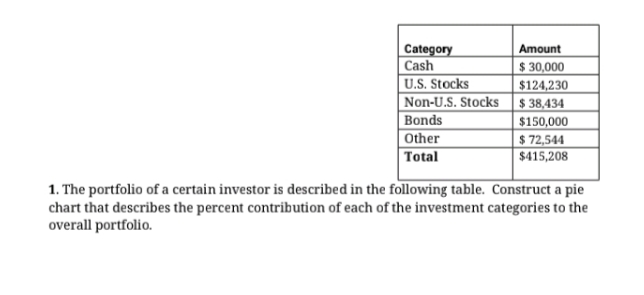
Category Cash U.S. Stocks Non-U.S. Stocks $ 38,434 Bonds Other Total Amount $ 30,000 $124,230 $150,000 $ 72,544 $415,208 1. The portfolio of a certain investor is described in the following table. Construct a pie chart that describes the percent contribution of each of the investment categories to the overall portfolio.


Q: (b) A portfolio consists of securities as follows: Units Current market Average buying price (RM)…
A: Portfolio: It is a mix or combination of different assets in which an investor invests to minimize…
Q: Assume that all the money available for investment is invested
A: Given information is: A private investment club has $200,000 earmarked for investment in stocks. To…
Q: Use the following table: Series Large stocks Small stocks Average return 11.88 % 16.58 6.29…
A: Return on Portfolio = (W1 x Average Return on S1)+ (W2 x Average Return S2)
Q: You deposited P100,000 cash in brokerage account and short sell P200,000 of stocks on margin. Later…
A: Computation:
Q: 1. Preferred stock issued in exchange for land would be reported in the statement of cash flows in…
A: 1) Cash Flow Statement has three parts- Cash Flow from Operating Activities: All cash flows from…
Q: Consider the following table. Name Stocks Bonds Other Assets Liabilities Outstanding Shares Amount…
A: given information stocks = 150 millions bonds = 50 millions other assets = 300,000 liabilities =…
Q: CALCULATE THE WEIGHTED AVERAGE COSTS OF CAPITAL Short-Term Liabilities: COST Suppliers 1,240,000.00…
A: Weighted Average Cost OF Capital (WACC) =E / (E + D) * Ke + D / (E + D) * Kd E = Equity Value D =…
Q: Subject: FInancial strategy & policy Question # 2 (part ii) ii) You plan to invest in the Kish…
A: Given Information : Total capital = $500 million Risk free rate = 6%
Q: An investor purchases a mutual fund share for $100.2. The fund pays dividends of $2.2, distributes a…
A: Purchase price (P0) = $ 100.2 Dividend (D) = $ 2.2 Capital gain (CG) = $ 1.1 Fees charges (F) = $ 3…
Q: Lassiter Equity Fund 1/1/21 12/31/21 Assets $250,000,000 $282,000,000 Liabilities…
A: Mutual funds are one of the investment opportunities available for investors to invest. The NAV of…
Q: What is Declan's Designs' 2022 total "Common Stock Issuance" to be reported on its Statement of Cash…
A: The cash flow statement is prepared to record the cash flow from various activities during the…
Q: Calculate the total cost (in $), proceeds (in $), total gain (or loss) (in $), and return on…
A: Mutual Funds: These are the companies that pool the investments of different investors into one huge…
Q: Stock Shares Stock Price $94 8,000 33,000 C 4,600 80,500 81 12 If there are 54,000 shares of the…
A: Here,
Q: A mutual fund had average daily assets of $4.0 billion in 2016. The fund sold $1.5 billion worth of…
A: Fund's Turnover Ratio = Stock Sold / Average daily assets
Q: nvestment weight of each stoc
A: An investment portfolio refers to the various financial investments such as stocks, bonds, cash,…
Q: Bulldogs Co. has a collection of publicly traded stocks. The value of each security and its stock…
A: Answer) Calculation of Required Rate of Return of the Portfolio Required rate of return = Risk free…
Q: KCG, Inc. has the following mix of funds and costs Туpe Amount Cost Debt P 150,000 18% Preferred…
A: WEIGHTED AVERAGE COST OF CAPITAL (WACC) IS A CALCULATION OF FIRM'S COST OF CAPITAL IN WHICH EACH…
Q: Consider a mutual fund with $250 million in assets at the start of the year and 10 million shares…
A: Net asset value (NAV) is a method that helps to evaluate the value of a company. It also provides…
Q: ne of the most important features of a stock is its book value. The book value per share of…
A: EPS is the amount of earnings given to the shareholders for holding one share. It is computed from…
Q: 9. Given the following information: Total assets S Total liabilities S 360,000,000 18,000,000…
A: Net asset value is calculated in the case of mutual funds. It is the value per share after the…
Q: 4. CMD Asset Management has the following fee structure for clients in its equity fund: 1.00% of…
A: a. The annual dollar fees paid by client 1 is calculated below:
Q: Investing: Inverse ETFS (Exchange Traded Funds) Inverse ETFS, sometimes referred to as "bear market"…
A: Given: YTD Loss MYY 6% SH 5% REW 7% Total Investment $12,000 Year-till-date…
Q: 24. LS Portfolio Fund invests in the stock markets. It diversifies its funds across many industries.…
A: Total Fund = 90,000,000 Number of shares outstanding = 5,000,000 Increase in value = 15% Dividend…
Q: Find the standard deviation of 12
A: Standard Deviation: It is a measure of risk for an investment or security. Also, in measures, the…
Q: 9% Preference Shares 4,00,000 Reserve and Surplus 2,00,000 Surplus i.e., Balance in Statement of…
A: solution mathematically return on capital employed =EBIT / capital employed Given EBIT =…
Q: • Net income: 34 • Interest expense: 9 • number of bond 15 ,price 22 • Depreciation and…
A: Net income is also perceived as income after taxation. If income tax rate is 35%, then earnings…
Q: 15)Consider the following data on two mutual funds: Fund A Fund B Total net assets (assets less…
A: “Since you have posted a question with multiple sub-parts, we will solve first three subparts for…
Q: (Quantitative Question) Consider the following average annual returns: Investment Average Return…
A: Excess of average return is the excess return over the risk free rate. Average return of treasury…
Q: SOLVE FOR THE RETURN ON EQUITY
A: Return on equity is a measure of return available for the equity holders of a company. It is…
Q: What is Declan's Designs' 2022 total "Common Stock Issuance" to be reported on its Statement of Cash…
A: The cash flow statement is prepared to record the cash flow from various activities during the…
Q: 1. What is the expected rate of return for the Philippine Stock Index Portfolio? STOCK MARKET VALUE…
A: A group of financial assets such as stocks, bonds, commodities, cash, and cash equivalents, as well…
Q: Using arithmetic means, what is the risk premium for small company stocks? What is the risk premium…
A: The question is based on the calculation of Risk premium, which is define as extra return over risk…
Q: Rank the following from highest average historical return to lowest average historical return from…
A: Answer: 1, 3, 2, 4
Q: The western capital growth mutual fund has Total assets 812,000,000 Total liabilities 12,000,000…
A: NAV represent the market value of securities held by mutual fund. NAV can be calculated by using…
Q: Given the information below. Find the Weighted Average Cost of Capital Market Value of Equity =…
A: Weighted Average Cost of Capital(WACC) is the average cost of capital. It can be calculated by using…
Q: Calculate the range of potential annual returns if you invested 10% in bonds and 90% in stocks. How…
A: a) 10% in bonds and 90% in stocks Range of potential return which is evident from the graph given is…
Q: Can you explain the information below market value added (MVA) analysis and interpretation of…
A: MVA means net increase in the value of the firm. It mainly depends upon the share price because the…
Q: Consider the following trading and performance data for four different equity mutual funds:…
A: Introduction: Usually, a portfolio turnover ratio is calculated by dividing securities value with…
Q: An exchange traded fund (ETF) is a security that represents a portfolio of individual stocks.…
A: The ETF is trading at $366. The current price of IBM is $121.57. The current price of MRK is $36.59.…
Q: Berikut adalah portfolio yang dipegang oleh Suzi: (Following is the portfolio held by Suzi)] Stok…
A: Investors have different options to make investments, and the motive behind investments is to…

Step by step
Solved in 3 steps with 1 images


- What is the beta of the portfolio held by Blue Co.? Blue Co. has portfolio fund consist of three stock s as follows stock invetsment beta monde 2,500,000 1.3 bdo 1,300,000 average pal 1,200,000 (.50)The composition of the Fingroup Fund portfolio is as follows: Stock Shares Price A 200,000 $ 39 B 284,000 32 C 408,000 28 D 680,000 35 During the year the portfolio manager sells all of the holdings of stock D and replaces it with 200,000 shares of stock E at $50 per share and 230,000 shares of stock F at $60 per share. What is the portfolio turnover rate? (Round your answer to 1 decimal place.)Use the following tables to assess the worthiness of Verticon stock as an investment. Verticon Stock Data (Current and Historical) 3:45PM EDT Aug 16, 2011 Price 18.85 USD Change +0.64 (+3.51%) Mkt cap 147.1B Div/yield 0.20/4.24 Shares 8,012 Beta 0.70 Book/share 11.335 EPS 1.11 12/2010 12/2009 12/2008 (Millions of Dollars) Total Assets 195,014 195,949 111,148 Total Liabilities 107,201 122,935 53,592 Preferred Shareholders’ Equity 52 61 73 Common Shareholders’ Equity 87,761 72,953 57,483 Shares Outstanding 8,012 8,070 6746 Book/Share ? 9.040 8.521 Q1 (Mar ’11) 2010 Net profit margin 15.24% 12.24% Return on equity 11.60% 9.30% Which one in bold? One of the most important features of a stock is its book value. The book value per share of Verticon’s stock for the year 2010 was equal to (10.954, 13.693, 11.502). Looking at the (Market cap, EPS, change in price, beta value, ROE) ,…
- Calculate the required rate of return for the Wagner Assets Management Group, which holds 4 stocks. The market's required rate of return is 17.0%, the risk-free rate is 7.0%, and the Fund's assets are as follows: Stock Investment Beta A $200,000 1.50 B 300,000 −0.50 C 500,000 1.25 D 1,000,000 0.75 Select the correct answerPortfolio beta and weights Rafael is an analyst at a wealth management firm. One of his clients holds a $10,000 portfolio that consists of four stocks. The investment allocation in the portfolio along with the contribution of risk from each stock is given in the following table: Stock Investment Allocation Beta Standard Deviation Atteric Inc. (AI) 35% 0.900 23.00% Arthur Trust Inc. (AT) 20% 1.400 27.00% Li Corp. (LC) 15% 1.100 30.00% Transfer Fuels Co. (TF) 30% 0.300 34.00% Rafael calculated the portfolio’s beta as 0.850 and the portfolio’s required return as 8.6750%. Rafael thinks it will be a good idea to reallocate the funds in his client’s portfolio. He recommends replacing Atteric Inc.’s shares with the same amount in additional shares of Transfer Fuels Co. The risk-free rate is 4%, and the market risk premium is 5.50%. According to Rafael’s recommendation, assuming that the market is in equilibrium, how much will the portfolio’s required…Portfolio beta and weights Brandon is an analyst at a wealth management firm. One of his clients holds a $5,000 portfolio that consists of four stocks. The investment allocation in the portfolio along with the contribution of risk from each stock is given in the following table: Stock Investment Allocation Beta Standard Deviation Atteric Inc. (AI) 35% 0.750 38.00% Arthur Trust Inc. (AT) 20% 1.500 42.00% Li Corp. (LC) 15% 1.100 45.00% Baque Co. (BC) 30% 0.300 49.00% Brandon calculated the portfolio’s beta as 0.818 and the portfolio’s required return as 8.4990%. Brandon thinks it will be a good idea to reallocate the funds in his client’s portfolio. He recommends replacing Atteric Inc.’s shares with the same amount in additional shares of Baque Co. The risk-free rate is 4%, and the market risk premium is 5.50%. According to Brandon’s recommendation, assuming that the market is in equilibrium, how much will the portfolio’s required return change?…
- . Portfolio beta and weights Brandon is an analyst at a wealth management firm. One of his clients holds a $5,000 portfolio that consists of four stocks. The investment allocation in the portfolio along with the contribution of risk from each stock is given in the following table: Stock Investment Allocation Beta Standard Deviation Atteric Inc. (AI) 35% 0.750 38.00% Arthur Trust Inc. (AT) 20% 1.500 42.00% Li Corp. (LC) 15% 1.100 45.00% Baque Co. (BC) 30% 0.300 49.00% Brandon calculated the portfolio’s beta as 0.818 and the portfolio’s required return as 8.4990%. Brandon thinks it will be a good idea to reallocate the funds in his client’s portfolio. He recommends replacing Atteric Inc.’s shares with the same amount in additional shares of Baque Co. The risk-free rate is 4%, and the market risk premium is 5.50%. Suppose instead of replacing Atteric Inc.’s stock with Baque Co.’s stock, Brandon considers replacing Atteric Inc.’s stock with the equal…You are given the following information regarding prices for a sample of stocks. PRICE PER SHARE Stock Number of Shares Jan December Honda 20 000 170 200 Nissan 40 000 130 155 Toyota 90 000 138 145 i.) Construct a price-weighted index for these three stocks for January and December ii.) Construct a value weighted index for the securities above for January and December iii) Construct an equal-weighted index by assuming $1,000 is invested in each stock. What is the percentage change in wealth for this portfolio?The composition of the Fingroup Fund portfolio is as follows: Stock Shares Price A 280,000 $ 35 B 380,000 40 C 480,000 15 D 680,000 20 If during the year the portfolio manager sells all of the holdings of stock D and replaces it with 170,000 shares of stock E at $50 per share and 170,000 shares of stock F at $30 per share, what is the portfolio turnover rate? (Round your answer to 2 decimal places.)
- The composition of the Fingroup Fund portfolio is as follows: Stock shares price A 200,000 $ 33 B 278,000 41 C 411,000 31 D 570,000 50 During the year the portfolio manager sells all of the holdings of stock D and replaces it with 200,000 shares of stock E at $60 per share and 220,000 shares of stock F at $75 per share. What is the portfolio turnover rate?Suppose you manage an equity fund with the following securities. Use the following data to help build an active portfolio. Input Data Vogt Industries Isher Corporation Hedrock, Incorporated Alpha 0.012 0.006 0.016 Beta 0.277 1.015 1.630 Standard Deviation 0.156 0.168 0.181 Residual Standard Deviation 0.117 0.048 0.113 Information Ratio 0.1026 0.1250 0.1416 Alpha/Residual Variance 0.877 2.604 1.253 Market Data S&P 500 Treasury Bills Expected Raturn 12.00% 2.50% Standard Deviation 20.00% 0.00% Required: Using the information in the table above, please first calculate the initial weight of each stock in an active portfolio, using the Treynor Black approach. Then adjust each weight for beta. (Use cells A5 to D14 from the given information to complete this question.) Treynor-Black Model Vogt Industries Isher Corporation Hedrock, Incorporated…What is the expected return for the following portfolio? (State your answer in percent with two decimal places.) Stock Expected returns Investment AAA 35% $500,000 BBB 29% $1,300,000 CCC 18% $1,200,000 DDD 7% $1,500,000 O.17.13% O.19.40% O.21.01% O.22.21% O.23.88%