Figure 5. The mixture of assets defines the spectrum of returns Best, worst, and average returns for various stock/bond allocations, 1926-2016 Portfolio allocation 100% 80% 10% 70% 30% 90% 60% 50% 40% 30% 20% 0% Bonds 0% 10% 20% 40% 50% 60% 70% 80% 90% 100% Stocks Annual returns 60% 54.2% 49.8% 50 45.4% 41.1% 40 36.7% 32.6% 31.2% 32.3% 29.8% 28.4% 27.9% 30 20 10 7.2% 7.7% 8.2% 8.7% 9.1% 9.5% 9.9% 10.2% Average 5.4% 6.0% 6.6% -10 -8.1% -8.2% -10.1% -20 -14.2% -18.4% -22.5% -30 -26.6% -30.7% -40 -34.9% -39.0% -50 -43.1%
Figure 5. The mixture of assets defines the spectrum of returns Best, worst, and average returns for various stock/bond allocations, 1926-2016 Portfolio allocation 100% 80% 10% 70% 30% 90% 60% 50% 40% 30% 20% 0% Bonds 0% 10% 20% 40% 50% 60% 70% 80% 90% 100% Stocks Annual returns 60% 54.2% 49.8% 50 45.4% 41.1% 40 36.7% 32.6% 31.2% 32.3% 29.8% 28.4% 27.9% 30 20 10 7.2% 7.7% 8.2% 8.7% 9.1% 9.5% 9.9% 10.2% Average 5.4% 6.0% 6.6% -10 -8.1% -8.2% -10.1% -20 -14.2% -18.4% -22.5% -30 -26.6% -30.7% -40 -34.9% -39.0% -50 -43.1%

Fundamentals of Financial Management, Concise Edition (with Thomson ONE - Business School Edition, 1 term (6 months) Printed Access Card) (MindTap Course List)
8th Edition
ISBN:9781285065137
Author:Eugene F. Brigham, Joel F. Houston
Publisher:Eugene F. Brigham, Joel F. Houston
Chapter8: Risk And Rates Of Return
Section: Chapter Questions
Problem 22SP

Related questions
Question
- Calculate the range of potential annual returns if you invested 10% in bonds and 90% in stocks. How does this range compare with the range of annual returns if you invested 10% in stocks and 90% bonds?
- What might you say to someone whose reason for investing in 90% bonds and 10% stocks is that they want a 6% return on investment?
- Use evidence from this graph to explain the value of investing in both stocks and bonds - not just one or the other.
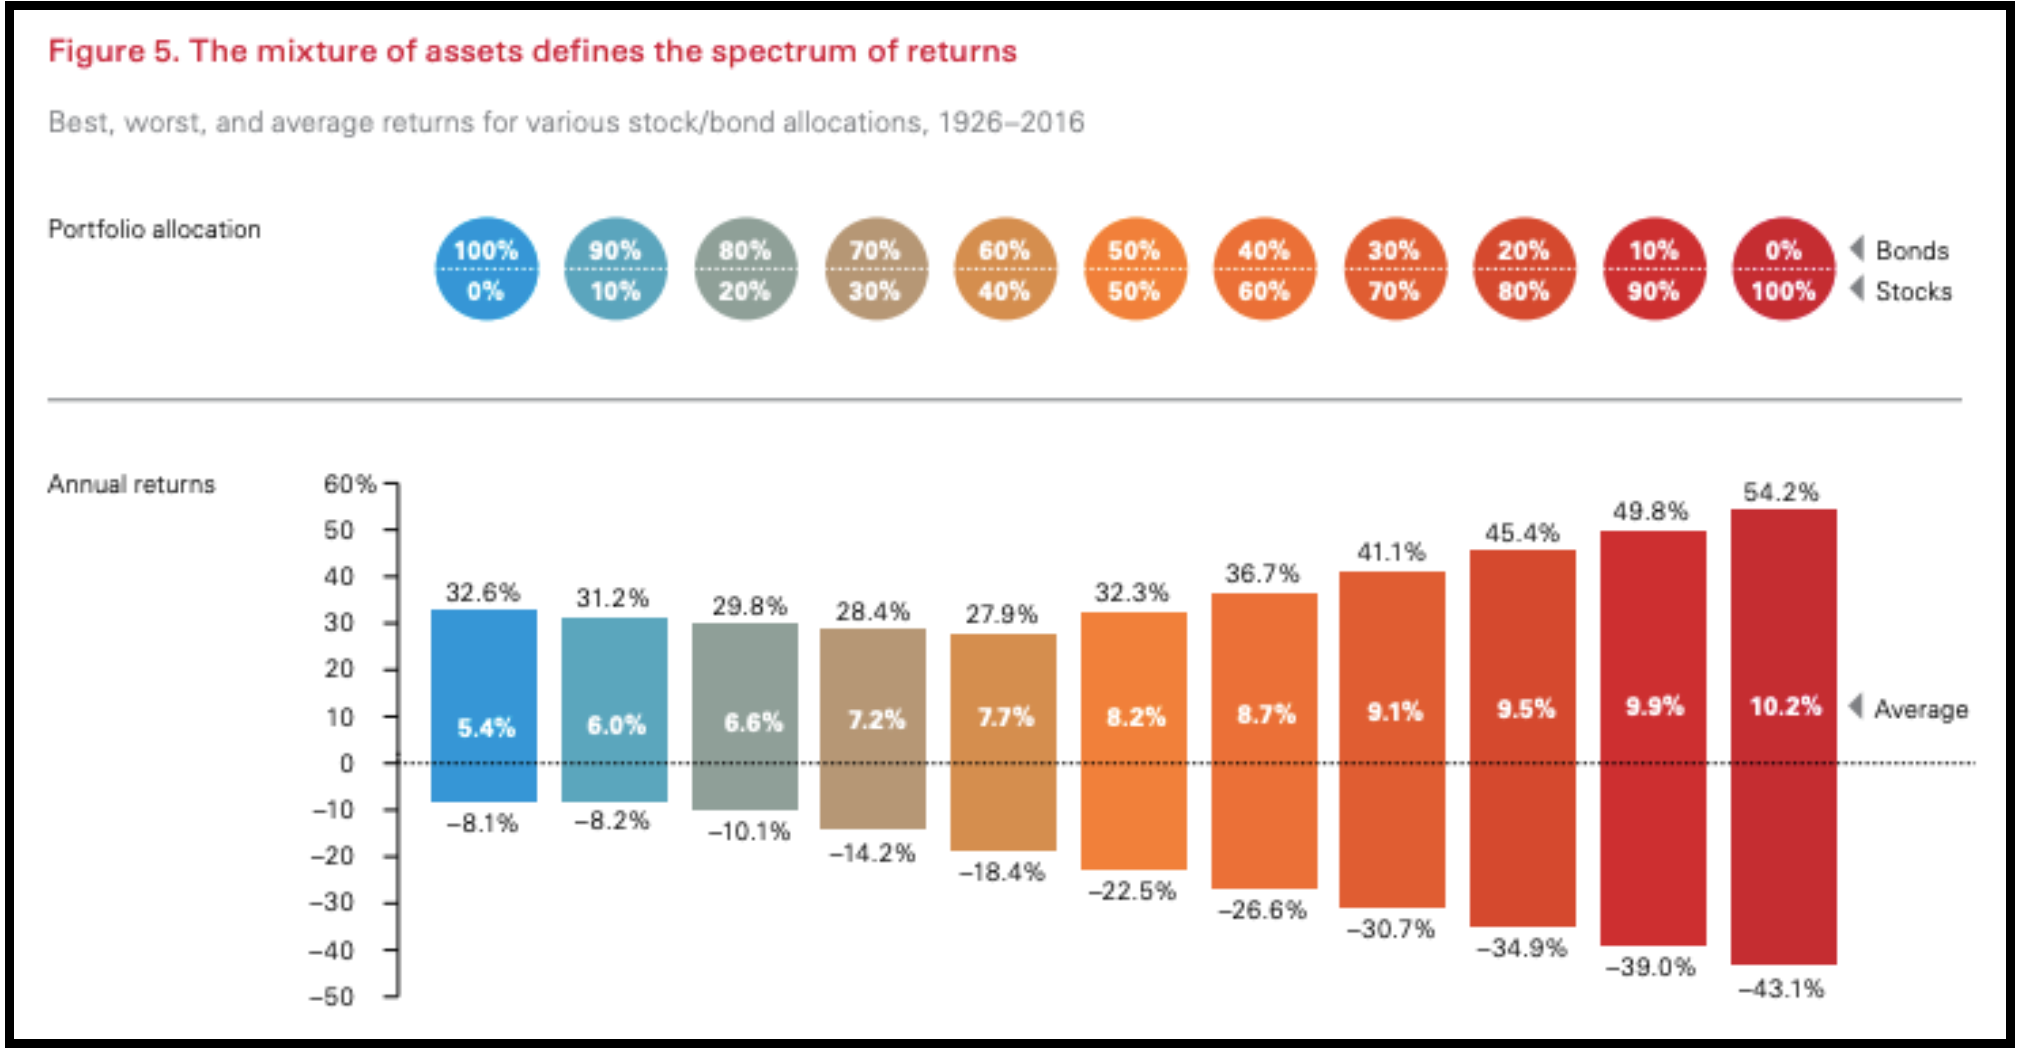
Transcribed Image Text:Figure 5. The mixture of assets defines the spectrum of returns
Best, worst, and average returns for various stock/bond allocations, 1926-2016
Portfolio allocation
100%
80%
10%
70%
30%
90%
60%
50%
40%
30%
20%
0%
Bonds
0%
10%
20%
40%
50%
60%
70%
80%
90%
100%
Stocks
Annual returns
60%
54.2%
49.8%
50
45.4%
41.1%
40
36.7%
32.6%
31.2%
32.3%
29.8%
28.4%
27.9%
30
20
10
7.2%
7.7%
8.2%
8.7%
9.1%
9.5%
9.9%
10.2%
Average
5.4%
6.0%
6.6%
-10
-8.1%
-8.2%
-10.1%
-20
-14.2%
-18.4%
-22.5%
-30
-26.6%
-30.7%
-40
-34.9%
-39.0%
-50
-43.1%
Expert Solution
This question has been solved!
Explore an expertly crafted, step-by-step solution for a thorough understanding of key concepts.

This is a popular solution!

Trending now
This is a popular solution!

Step by step
Solved in 2 steps

Knowledge Booster


Learn more about
Need a deep-dive on the concept behind this application? Look no further. Learn more about this topic, finance and related others by exploring similar questions and additional content below.Recommended textbooks for you
Fundamentals of Financial Management, Concise Edi…
Finance
ISBN:
9781285065137
Author:
Eugene F. Brigham, Joel F. Houston
Publisher:
Cengage Learning

Fundamentals of Financial Management, Concise Edi…
Finance
ISBN:
9781305635937
Author:
Eugene F. Brigham, Joel F. Houston
Publisher:
Cengage Learning

Fundamentals of Financial Management (MindTap Cou…
Finance
ISBN:
9781285867977
Author:
Eugene F. Brigham, Joel F. Houston
Publisher:
Cengage Learning
Fundamentals of Financial Management, Concise Edi…
Finance
ISBN:
9781285065137
Author:
Eugene F. Brigham, Joel F. Houston
Publisher:
Cengage Learning
Fundamentals of Financial Management, Concise Edi…
Finance
ISBN:
9781305635937
Author:
Eugene F. Brigham, Joel F. Houston
Publisher:
Cengage Learning
Fundamentals of Financial Management (MindTap Cou…
Finance
ISBN:
9781285867977
Author:
Eugene F. Brigham, Joel F. Houston
Publisher:
Cengage Learning