charts the daily high and low temperatures in NYC in nyc weather 2021.csv
charts the daily high and low temperatures in NYC in nyc weather 2021.csv

Database System Concepts
7th Edition
ISBN:9780078022159
Author:Abraham Silberschatz Professor, Henry F. Korth, S. Sudarshan
Publisher:Abraham Silberschatz Professor, Henry F. Korth, S. Sudarshan
Chapter1: Introduction
Section: Chapter Questions
Problem 1PE

Related questions
Question
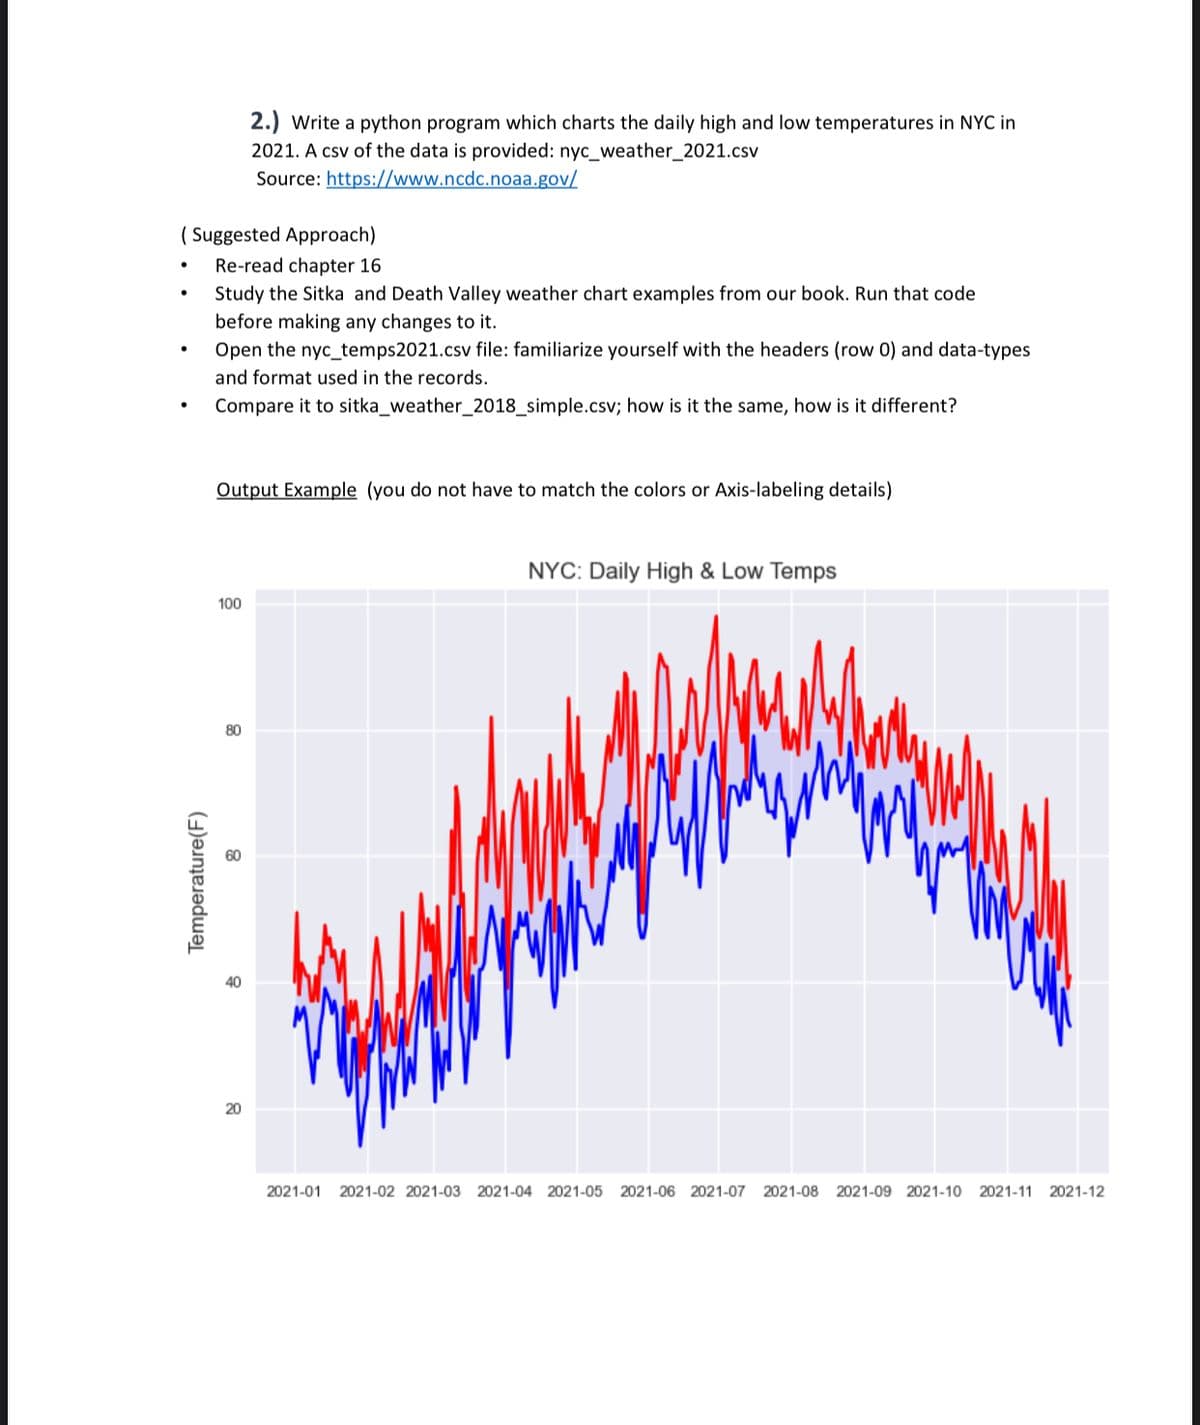
Transcribed Image Text:2.) Write a python program which charts the daily high and low temperatures in NYC in
2021. A csv of the data is provided: nyc_weather_2021.csv
Source: https://www.ncdc.noaa.gov/
( Suggested Approach)
Re-read chapter 16
Study the Sitka and Death Valley weather chart examples from our book. Run that code
before making any changes to it.
Open the nyc_temps2021.csv file: familiarize yourself with the headers (row 0) and data-types
and format used in the records.
Compare it to sitka_weather_2018_simple.csv; how is it the same, how is it different?
Output Example (you do not have to match the colors or Axis-labeling details)
NYC: Daily High & Low Temps
100
80
20
2021-01
2021-02 2021-03 2021-04 2021-05 2021-06 2021-07 2021-08
2021-09 2021-10
2021-11 2021-12
Temperature(F)
Expert Solution
This question has been solved!
Explore an expertly crafted, step-by-step solution for a thorough understanding of key concepts.

This is a popular solution!

Trending now
This is a popular solution!

Step by step
Solved in 2 steps

Knowledge Booster


Learn more about
Need a deep-dive on the concept behind this application? Look no further. Learn more about this topic, computer-science and related others by exploring similar questions and additional content below.Recommended textbooks for you
Database System Concepts
Computer Science
ISBN:
9780078022159
Author:
Abraham Silberschatz Professor, Henry F. Korth, S. Sudarshan
Publisher:
McGraw-Hill Education

Starting Out with Python (4th Edition)
Computer Science
ISBN:
9780134444321
Author:
Tony Gaddis
Publisher:
PEARSON

Digital Fundamentals (11th Edition)
Computer Science
ISBN:
9780132737968
Author:
Thomas L. Floyd
Publisher:
PEARSON
Database System Concepts
Computer Science
ISBN:
9780078022159
Author:
Abraham Silberschatz Professor, Henry F. Korth, S. Sudarshan
Publisher:
McGraw-Hill Education
Starting Out with Python (4th Edition)
Computer Science
ISBN:
9780134444321
Author:
Tony Gaddis
Publisher:
PEARSON
Digital Fundamentals (11th Edition)
Computer Science
ISBN:
9780132737968
Author:
Thomas L. Floyd
Publisher:
PEARSON

C How to Program (8th Edition)
Computer Science
ISBN:
9780133976892
Author:
Paul J. Deitel, Harvey Deitel
Publisher:
PEARSON

Database Systems: Design, Implementation, & Manag…
Computer Science
ISBN:
9781337627900
Author:
Carlos Coronel, Steven Morris
Publisher:
Cengage Learning

Programmable Logic Controllers
Computer Science
ISBN:
9780073373843
Author:
Frank D. Petruzella
Publisher:
McGraw-Hill Education