Chi-square Test In the pea plants use by Gregor Mendel in his study, the purple flower color is dominant over white, and the axial position on a branch is dominant over terminal. A plant believed to be heterozygous was selfed and produced flowers with the following phenotypes: 23 white terminal 68 white axial 81 purple terminal 187 purple axial a. assign alleles to the different traits purple __________ axial ___________ white ___________ terminal _______ b. refer to the image attached
Chi-square Test In the pea plants use by Gregor Mendel in his study, the purple flower color is dominant over white, and the axial position on a branch is dominant over terminal. A plant believed to be heterozygous was selfed and produced flowers with the following phenotypes: 23 white terminal 68 white axial 81 purple terminal 187 purple axial a. assign alleles to the different traits purple __________ axial ___________ white ___________ terminal _______ b. refer to the image attached

Chapter5: What Is In A Name
Section: Chapter Questions
Problem 6FITB

Related questions
Question
Chi-square Test
In the pea plants use by Gregor Mendel in his study, the purple flower color is dominant over white,
and the axial position on a branch is dominant over terminal. A plant believed to be heterozygous
was selfed and produced flowers with the following
23 white terminal
68 white axial
81 purple terminal
187 purple axial
a. assign alleles to the different traits
purple __________ axial ___________
white ___________ terminal _______
b. refer to the image attached
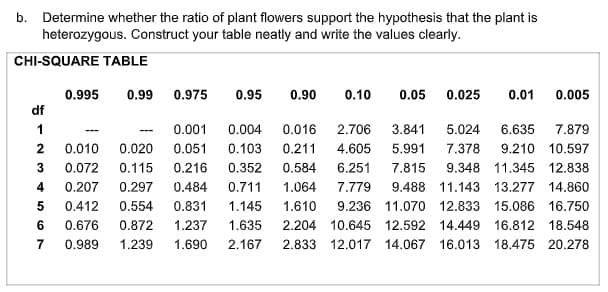
Transcribed Image Text:b. Determine whether the ratio of plant flowers support the hypothesis that the plant is
heterozygous. Construct your table neatly and write the values clearly.
CHI-SQUARE TABLE
0.995
0.99
0.975
0.95
0.90
0.10
0.05
0.025
0.01
0.005
df
0.001
0.004
0.016
2.706
3.841
5.024
6.635
7.879
---
---
2
0.010
0.020
0.051
0.103
0.211
4.605
5.991
7.378
9.210 10.597
0.072
0.115
0.216
0.352
0.584
6.251
7.815
9.348 11.345 12.838
4
0.207
0.297
0.484
0.711
1.064
7.779
9.488 11.143 13.277
14.860
0.412
0.554
0.831
1.145
1.610
9.236 11.070 12.833 15.086 16.750
6
0.676
0.872
1.237
1.635
2.204 10.645 12.592 14.449 16.812 18.548
7
0.989
1.239
1.690
2.167
2.833 12.017 14.067 16.013 18.475 20.278
Expert Solution
This question has been solved!
Explore an expertly crafted, step-by-step solution for a thorough understanding of key concepts.

This is a popular solution!

Trending now
This is a popular solution!

Step by step
Solved in 4 steps

Recommended textbooks for you